
Abstract
Photon-counting detector computed tomography (PCD-CT) employs direct-conversion detectors that record the arrival and energy of individual photons, enabling high-resolution, multi-energy cardiovascular imaging. We searched MEDLINE, Embase, and Scopus from January 2021 through September 2025 and included 59 studies. Owing to heterogeneity in study designs, protocols, and endpoints, the findings were synthesized narratively across five domains (coronary, myocardial, structural/valvular, pulmonary–cardiopulmonary function, and aortic/visceral/peripheral arteries). In coronary imaging, a routine-practice cohort (n = 7.833) reported a per-patient specificity of 98% vs. 93%, lower invasive angiography of 9.9% vs. 13.1%, and a higher revascularization yield of 43.4% vs. 35.5% [PCD-CT vs. energy-integrating detector CT (EID-CT); ultra-high-resolution protocols achieved a vessel-level area under the curve (AUC) of up to 0.99. Low-dose CCTA was feasible at a CTDIvol of 1.72 mGy, and contrast-saving protocols supported diagnostic studies with a volume of 30 mL. Virtual non-contrast calcium scoring showed an intraclass correlation coefficient of 0.98 vs. true non-contrast. In myocardial tissue characterization, PCD-CT-derived extracellular volume differed from cardiovascular magnetic resonance by ≤2% in selected cohorts, with a kappa of up to 0.956 for late-enhancement agreement; segment-level inflammation classification reached an AUC of 0.95. For structural/valvular assessment, a comparative cohort reported an effective dose of 8.8 ± 4.5 vs. 15.3 ± 5.8 mSv, with visual image quality scores of 4.8 vs. 3.3, respectively, for PCD-CT vs. EID-CT. Lung-perfusion iodine maps for chronic thromboembolic pulmonary hypertension achieved an accuracy of 0.85–0.88 at approximately one-fifth of the dose of single-photon emission CT. For aortic/peripheral applications, thoracoabdominal protocols reported a dose of 4.2 ± 1.4 vs. 7.2 ± 2.2 mGy, with a higher signal-to-noise ratio/contrast-to-noise ratio (PCD-CT vs. EID-CT); infrapopliteal imaging used 60 versus 140 mL of contrast, respectively, with improved vessel sharpness for PCD-CT vs. EID-CT; diagnostic performance for peripheral stenosis reached a sensitivity of 91% and a specificity of 95%, respectively, when compared with digital subtraction angiography. Overall, the evidence—predominantly single center—indicates that PCD-CT may enable dose- and contrast-efficient cardiovascular imaging with strong diagnostic metrics, and confirmation in multicenter outcome and cost-effectiveness studies remains a priority.
Keywords: Photon counting, computed tomography, cardiovascular imaging, diagnostic accuracy, computed tomography angiography
Main points
• This scoping review synthesizes findings from 59 clinical studies evaluating photon-counting detector computed tomography (PCD-CT) in cardiovascular imaging.
• PCD-CT can provide higher spatial resolution and spectral detail than energy-integrating detector CT, enhancing the detection of small anatomical structures and subtle pathologies.
• In selected protocols and cohorts, PCD-CT can reduce radiation exposure and contrast-medium use, typically by up to 40%–60%, although effects vary by indication and technique.
• Its multi-energy capabilities can enable functional assessments—such as myocardial characterization and pulmonary perfusion mapping—often within a single scan.
Cardiovascular computed tomography (CT) is a critical tool for the non-invasive assessment of coronary artery disease, myocardial tissue pathology, structural/valvular disease, pulmonary vascular disorders, and aortic/peripheral arterial pathology. Photon-counting detector CT (PCD-CT) represents a shift in detector design. By registering the arrival and energy of individual X-ray photons, PCD-CT can reduce electronic noise and support high-resolution (HR), multi-energy imaging more effectively than energy-integrating detector CT (EID-CT).
PCD-CT can achieve submillimeter spatial resolution at routine radiation doses, enabling coronary CT angiography (CCTA) that depicts 1–2-mm distal vessels and fine morphologic features (e.g., non-calcified plaques, napkin-ring signs, ostial lesions). In parallel, energy-based photon weighting can mitigate calcium and stent blooming and improve in-stent lumen depiction and calcium quantification compared with EID-CT.,,, Beyond morphology, the multi-energy output allows retrospective monoenergetic reconstructions, iodine maps, and (where available) K-edge material decomposition. These capabilities have supported single-acquisition protocols capturing coronary and myocardial phases, in vivo plaque imaging, and angiographic strategies that have reported a higher contrast-to-noise ratio (CNR) with iodine dose reductions of up to 40% in selected settings. Low-keV reconstructions have been reported to maintain diagnostic quality despite suboptimal bolus timing and to facilitate single-scan endoleak evaluation after aortic repair.,,,,,
These capabilities extend beyond coronary imaging: iodine-based maps and delayed-enhancement surrogates enable myocardial tissue characterization; HR sizing and peripheral access planning support structural/valvular workflows; iodine mapping supports pulmonary perfusion assessment alongside embolus detection; and low-keV reconstructions can improve vascular conspicuity in aortic and peripheral arteries, enabling contrast-saving protocols.,,,,, Given heterogeneity in protocols, reconstructions, and endpoints across studies, a structured synthesis is warranted.
Accordingly, we present a state-of-the-art scoping review of peer-reviewed adult cardiovascular PCD-CT studies published through September 2025, synthesizing findings across five domains—coronary arteries, myocardial tissue, structural heart/valves, pulmonary–cardiopulmonary function, and aortic/visceral/peripheral arteries—and complementing these with clearly labeled, illustrative examples from our single-center experience [>1.000 PCD-CT examinations on a (Siemens, Forchheim, Germany), not included in the current synthesis].
Methods
A scoping literature review was conducted to map and summarize clinical studies of PCD-CT in cardiovascular imaging. The search covered January 2021 (onset of clinical availability) through September 1, 2025. Searches were performed in PubMed/MEDLINE, Embase, and Scopus using a broadened keyword set combining PCD-CT terms and cardiovascular terms. The core logic included PCD-CT synonyms (e.g., “photon-counting detector computed tomography,” “photon-counting CT,” “PCD-CT,” “SPCCT,” and device names where reported) AND cardiovascular concepts (cardiac, cardiovascular, coronary, vascular, myocardial, aorta, valvular/structural, TAVI/TAVR, pulmonary).
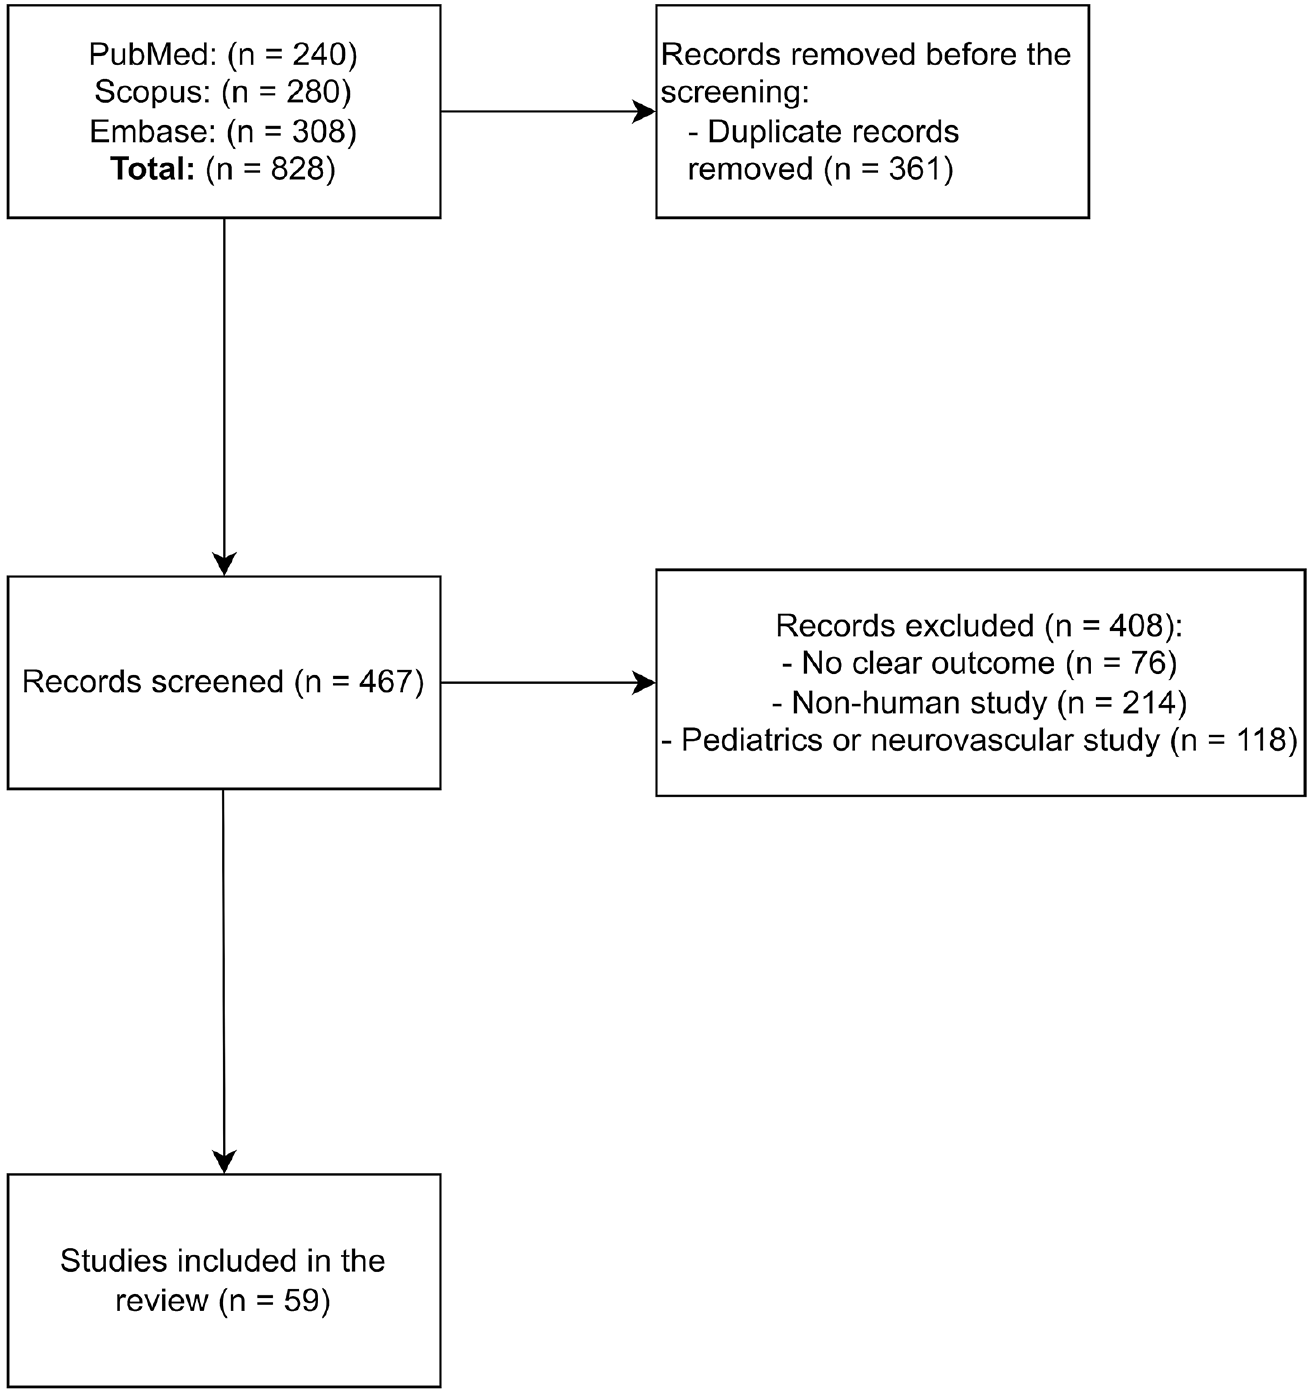
The initial search yielded 828 records. After deduplication and title/abstract screening, 467 records remained for full-text assessment. Original clinical studies in adults that used PCD-CT for any cardiovascular indication, were published in peer-reviewed journals, and reported at least one imaging, diagnostic, or workflow outcome were included. Phantom-, animal-, or simulation-only studies; pediatric or congenital cohorts; neurovascular studies; abstract-only publications; and purely technical reports without a clinical cohort were excluded. A total of 59 studies met the criteria and were included in the review. The evidence-identification flow is summarized in .
Two reviewers independently screened titles/abstracts and full texts, resolving disagreements by consensus. For each included study, the following was charted: study design and setting; patient characteristics; scanner/vendor; acquisition and reconstruction parameters [e.g., kilovolt peak (kVp), pitch, ultra-HR (UHR) protocols, virtual monoenergetic image (VMI) keV levels, kernels/iterative settings]; dose metrics as reported [CT dose index volume (CTDIvol), dose-length product (DLP), size-specific dose estimate (SSDE), and/or effective dose]; contrast volume; image-quality measures [objective and subjective, including the signal-to-noise ratio (SNR)/CNR when provided]; and diagnostic performance vs. the stated reference standard [e.g., area under the curve (AUC), sensitivity, specificity].
Given heterogeneity in populations, protocols, endpoints, and reporting formats, no quantitative pooling or meta-analysis was performed. Findings are synthesized narratively, with numeric ranges reported by application domain (coronary, myocardium, structural/valvular, pulmonary, aortic/peripheral).
Results
Coronary computed tomography angiography
A total of 31 investigations evaluating CCTA with PCD-CT were identified (). Study designs included retrospective and prospective diagnostic accuracy cohorts, protocol-optimization studies for radiation/contrast reduction, and quantitative assessments using virtual monoenergetic imaging and iterative reconstruction. Several studies used UHR (0.2 mm) acquisitions.,
Table 1. Photon-counting CT studies related to coronary CT angiography
Author | Journal | Study design | Cohort | Imaging | Results | Conclusion | |||
|---|---|---|---|---|---|---|---|---|---|
1. Greffier et al. 2023 | Eur Radiol. | Phantom + preliminary human | 8 pts + phantom | Spectral PCD-CT HR (0.67 mm) and UHR (0.43 mm) VMIs 40–90 keV | Across all keV, PCD-CT f peak, f 50, d′ > dual-layer DECT; radiologists rated lumen sharpness and IQ higher for PCD-CT | High- and ultra-high-resolution PCD-CT VMIs markedly enhance coronary-lumen detectability versus dual-energy CT | |||
2. Hagar et al. 2023 | Radiology. | Prospective diagnostic accuracy | 68 pts | Retrospectively ECG-gated UHR CCTA, 120/140 kV, 120 × 0.2 mm, 100 mL iopromid | AUC of 0.93 pp/0.94 pv/0.92 ps; sensitivity of 96%, specificity of 84%, accuracy of 88% (per patient) | UHR PCD-CT CCTA delivers high accuracy for CAD even in pts at high risk and with heavy calcification and stents | |||
3. Kahmann et al. 2023 | Front Cardiovasc Med. | Retrospective single-center radiomics analysis | 66 pts | First-gen PCD-CT; manual PCAT segmentation (LCA & RCA); pyradiomics | Two texture features (gldm_HighGrayLevelEmphasis 23.95 vs. 22.99; glrlm_HighGrayLevelRunEmphasis 24.21 vs. 23.31; P = 0.013–0.24) differentiated hyper-cholesterol emic vs. normo-lipidemic patients | PCAT radiomics on PCD-CT discriminates hypercholesterolemia, suggesting a non-invasive biomarker | |||
4. Mundt et al. 2023 | BMC Med Imaging. | Retrospective radiomics association | 55 pts | Unenhanced first-gen PCD-CT chest | Radiomics “glcm_ClusterProminence” differentiates Agatston 0 vs. ≥ 100; periaortic adipose texture and coronary calcium | Periaortic adipose radiomics on PCD-CT correlates with coronary calcium, hinting at inflammatory biomarker value | |||
5. Pinos et al. 2023 | Eur J Radiol. | Prospective intra-individual crossover | 20 pts | PCD-CT polychromatic + VMI of 40–70 keV vs. EID-CT | Coronary CNR and subjective sharpness higher for all PCD-CT reconstructions (especially BMI > 30 kg/m²) | PCD-CT significantly improves CCTA image quality over EID-CT, with greatest gain in pts with obesity | |||
6. Rajiah et al. 2023 | Invest Radiol. | Prospective two-cohort evaluation | 27 pts undergoing low-contrast + 26 pts undergoing routine-contrast | High-pitch (3.2) multi-energy PCD-CT CCTA; 30 vs. 60 mL iohexol; VMIs of 50 and 100 keV | CT numbers increased to 96% at 50 keV vs. 120 kV; CNR increased (P < 0.0001); CTDI of 2.5 vs. 3.1 mGy; CAD-RADS changed in 9 pts | High-pitch ME PCD-CT yields diagnostic CCTA at half the contrast dose, with VMI boosting CNR and reader confidence | |||
7. Rotkopf et al. 2023 | Int J Cardiovasc Imaging. | Retrospective feasibility analysis (FLASH mode) | 73 pts | Ultra-fast high-pitch PCD-CT coronary CTA | HRV strongly predicted image quality (P < 0.001); HR alone not independent | In FLASH PCD-CT CCTA, HRV—not absolute heart rate—is the key driver of motion artefacts and image degradation | |||
8. Vattay et al. 2023 | Eur Radiol. | Cross-sectional VMI energy sweep | 51 plaques/51 pts | Dual-source PCD-CT; VMIs of 40–180 keV (10 keV steps) vs. 120 kVp polychromatic | CP volume fell and LAP volume rose monotonically with keV; HU and CNR at 70 keV matched 120 kVp; all VMI CP volumes ≠ T3D (P < 0.05) | VMI energy strongly alters quantified plaque components—standardized thresholds are required for cross-study comparability | |||
9. Vecsey-Nagy et al. 2023 | J Cardiovasc Comput Tomogr. | Retrospective diagnostic agreement | 197 pts | PCD-CT VNI CCTA at 120/140 kV vs. true non-contrast | 18.3% false-zero reclassification; higher kVp decreased deviation (β = -0.21, P = 0.020); low-density CAC increased error | VNI CAC acceptable overall but misses low-density lesions; 140 kV improves agreement | |||
10. Araki et al. 2024 | Eur Heart J Imaging Methods Pract. | Prospective observational | 40 pts | Dual-source PCD-CT; 70 kVp, high-pitch helical; recon kernels Bv40 and Bv64 | CTDIvol of 1.72 ± 0.38 mGy, DLP of 29.1 ± 6.8 mGy·cm, and an effective dose of 0.41 ± 0.09 mSv; >95% segments “good” IQ; sharp kernel altered stenosis grading (P < 0.001) | Ultra-low-dose (≈ 0.4 mSv) PCD-CT CCTA feasible; sharp kernels maintain IQ and refine stenosis evaluation | |||
11. Cundari et al. 2024 | Acad Radiol. | Prospective three-arm CM-reduction study with VMI | 100 pts (groups 1–3) | Dual-source PCD-CT CCTA; 45 keV VMI; standard CM vs. -20% and -40% volume | At -20% CM: attenuation is 890 HU, CNR is 26, IQ equals standard; at -40% CM: attenuation 676 is HU, CNR is 21, and all but 1 scan diagnostic | High-contrast VMI on PCD-CT permits up to 40% contrast-media reduction while retaining diagnostic CCTA quality | |||
12. Kahmann et al. 2024 | Insights Imaging. | Retrospective single-center radiomics study | 61 pts and 306 plaques | First-gen PCD-CT, manual plaque segmentation, pyradiomics | Plaques with HR features/relevant stenosis showed higher heterogeneity (multiple texture features) and higher EAT density (P significant) | Plaque-texture radiomics plus elevated EAT density on PCD-CT improve identification of patients at elevated cardiac risk | |||
13. Haag et al. 2024 | Radiology. | Retrospective single-center comparison of PureCalcium VNC vs. true non-contrast CACS | 170 pts (contrast-enhanced PCD-CT CCTA + TNC) | Dual-source PCD-CT CCTA with PureCalcium VNC reconstruction; TNC acquired separately | ICC of 0.98 (95% CI: 0.97–0.99); κ = 0.88; 74% correctly classified; median Agatston scores of 4.8 vs. 2.7 (P = 0.99); TNC added 19.7% ± 8.8% dose | PureCalcium VNC can replace TNC for Agatston scoring, cutting radiation while maintaining plaque-burden class accuracy | |||
14. McCollough et al. 2024 | J Comput Assist Tomogr. | Prospective intra-individual comparison | 21 pts (42–46 arteries) | Dual-source PCD-CT CAC exam; 3- and 1-mm axial (Qr36/Qr56 QIR4); dose of 2.1 ± 0.6 mGy | PCD-CT Agatston & volume increased to 5–10 mm3/approximately 8–12 points vs. EID (P ≤ 0.001); dose 13% lower | PCD-CT yields slightly higher CAC scores while cutting the dose by 13% compared with EID-CT | |||
15. Fink et al. 2024 | Radiol Cardiothorac Imaging. | Prospective phantom + participant study | 63 pts + phantom | Contrast CCTA with VNC at 55–80 keV; QIR of 1–4; safety-net recon at 55 keV/QIR2/110 HU | Safety-net recon detected 89% (50/56) previously missed subtle plaques; ICC VNC vs. TNC improved to 0.51–0.61 | Safety-net VNC recon settings rescue detection of small, low-density plaques that standard VNC would miss | |||
16. Kahmann et al. 2024 | Front Cardiovasc Med. | Retrospective radiomics analysis (PCAT vs. CAD) | 36 pts | Manual LAD and RCA PCAT segmentation on PCD-CT; pyradiomics | “original_glszm_GrayLevelNonUniformity” lower in CAD-LAD (155.2) vs. non-CAD-LAD (163.2) and CAD-RCA (189.1); strongest differentiator by random-forest | PCD-CT-based PCAT texture distinguishes CAD pts, even in non-stenotic RCA, indicating systemic adipose alterations | |||
17. Mundt et al. 2024 | Diagnostics. | Retrospective radiomics study | 53 pts | Unenhanced PCD-CT; manual EAT segmentation; pyradiomics | Four texture features (GLRLM, GLSZM) differed between Agatston scores of 0 vs. 1–99/≥100 groups | PCD-CT-based EAT texture features associate with coronary calcium, offering a potential biomarker of perivascular inflammation | |||
18. Sharma et al. 2024 | Eur Radiol. | Cross-sectional VNC/VNI vs. true non-contrast | 88 pts | PCD-CT CCTA with VNC and VNI recon | VNC median CAC of 8.5 vs. TNC of 27.8 (underestimate); VNI of 72.2 (over-estimate); mis-classification in 55% vs. 32% | VNI recon classifies calcium risk better than VNC but still needs optimization before replacing TNC scan | |||
19. van der Bie et al. 2024 | Med Phys. | Retrospective dose audit + phantom IQ experiment | 143 pts + size-varying phantom | PCD-CT at 120 kV, 0.4 mm, kernels Bv40–56, QIR 3/4; mono-E at 40–55 keV tested | Large-patient phantom: PCD-CT detectability index (d′) increased by 31% vs. EID-CT; small/medium: EID increased by 7%–17% unless low-keV PCD-CT narrows gap to 1%–6% | Thin-slice PCD-CT at 120 kV maintains vessel detectability for large pts without dose penalty; low-keV recon may offset IQ gap in smaller pts | |||
20. Wang et al. 2024 | Int J Cardiovasc Imaging. | Phantom + pilot patient study | 12 pts + CACS phantom | Flash and sequence modes; 90/120/140 kV and Sn100/140 kV; recon at 70 keV | ICC > 0.99 in phantom, >0.98 in pts; RMSE of 5.4–11.5; dose decreased by16%–75% (flash); no CACS category change | PCD-CT provides accurate, repeatable calcium scoring with up to 75% dose reduction; flash Sn100/90/120 kV IQ20 advised | |||
21. Vattay et al. 2024 | Eur J Radiol. | Prospective protocol comparison | 45 pts | Standard (0.4/0.6 mm, Bv40/Bv44, QIR of 0–4) vs. UHR (0.2/0.4 mm, Bv44/Bv56, QIR 0–4) PCD-CT | Best CNR 25.8 ± 4.1 at 0.6 mm Bv40 QIR4; worst was 8.3 ± 1.6 at 0.4 mm Bv44 QIR0 (P < 0.001); highest subjective IQ on Bv44 QIR3/4 (std) and Bv56 QIR4 0.2 mm (UHR) | Tailoring slice-thickness, kernel and QIR leverages PCD-CT to maximize CCTA quality—UHR is feasible without sacrificing distal vessel detail | |||
22. Ayx et al. 2025 | Eur J Radiol. | Single-center PCD-CT CT-FFR vs. ICA | 28 pts | Dual-source PCD-CT CCTA; ΔCT-FFR (-1.8/+1.8 cm) threshold of ≥0.06 | ΔCT-FFR: PPV of 66.7%, NPV of 100%, accuracy of 74%; could have avoided ICA in 39% | On-site ΔCT-FFR with PCD-CT reliably flags hemodynamically significant stenoses and may reduce unnecessary catheterization | |||
23. Brendel et al. 2025 | Diagn Interv Imaging. | Retrospective AI vs. expert | 140 pts | Non-UHR PCD-CT; DL models CorEx and Spimed-AI | Patient-level: sensitivity of 97%, specificity of 82%, NPV of 99%, AUC of 0.90; vessel-level AUC of 0.92 | Deep-learning on routine-res PCD-CT detects ≥ 50% CAD with near-expert accuracy | |||
24. Fahrni et al. 2025 | Invest Radiol. | Prospective paired CCTA study against invasive angiography | 26 pts at very high risk (26 stenoses) | UHR spectral PCD-CT CCTA plus standard CT, both < 3 days before ICA | Mean error of 6% PCD-CT vs. 12% CT; sensitivity/specificity. 100%/90% vs. 75%/50%; 38% lesions reclassified by PCD-CT vs. 4% by CT | UHR SPCD-CT quantifies stenosis far more accurately than conventional CT, reclassifying CAD severity in > ⅓ cases | |||
25. Fahrni et al. 2025 | Eur Radiol. | Prospective paired PCD-CT vs. DECT | 26 high-risk pts | PCD-CT in UHR mode; 40 vs. 70 keV VMIs | Overall IQ score of 5 vs. 4 (P < 0.001); stenosis bias of -1% vs. -6% DECT; blooming unchanged (+2% vs. +7% DECT) | UHR 40 keV PCD-CT VMIs outperform DECT at both energies, giving sharper, more consistent coronary stenosis measurements | |||
26. Kaldas et al. 2025 | J Clin Med. | Cross-sectional TNC vs. VNC | 77 pts | PCD-CT recon: TNC at 3 × 3 and 3 × 1.5 mm, VNC at 3 × 3 and 3 × 1.5 mm | ICC of 0.97–0.99 across methods; κ of 0.94 for thin-slice TNC vs. 0.83–0.85 for VNC; slice/recon choices altered mean scores and mis-classification rate | VNC CACS shows excellent agreement but needs adjusted cut-offs; 1.5 slices minimize category errors | |||
27. Kotronias et al. 2025 | JACC Cardiovasc Imaging. | Prospective ICA-validated | 100 pts/257 vessels | UHR (0.2 mm) and multi-energy standard-resolution PCD-CTA vs. 3D QCA | Median luminal diff. of 3% (UHR) vs. 6% (SR, P < 0.001); per-vessel AUC of 0.99 vs. 0.94 (Δ0.05, P = 0.01); κ of 0.90 vs. 0.63 for CAD-RADS | UHR PCD-CTA closely matches 3D QCA and outperforms standard PCD-CT, especially in severe calcification | |||
28. Sakai et al. 2025 | J Am Coll Cardiol. | Retrospective device-comparative cohort | 7.833 pts (3.876 PCD-CT vs. 3.957 EID) | Routine CCTA on NAEOTOM Alpha PCD-CT scanner | Specificity of 98% vs. 93%; PPV of 83.3% vs. 63%; accuracy of 97.2% vs. 92.8%; ICA referral of 9.9% vs. 13.1%; revasc. of 43.4% vs. 35.5% | PCD-CT CCTA increases specificity/PPV and reduces unnecessary catheterization while guiding revascularization | |||
29. Sartoretti et al. 2025 | Int J Cardiovasc Imaging. | Retrospective temporal-resolution study | 70 pts | ECG-gated non-contrast PCD-CT; reconstructions of 66 vs. 125 ms | CAC, AVC, MAC smaller at 66 ms (P < 0.001); CAC category re-class in 4%; blur artifacts decrease at 66 ms | Higher temporal resolution (66 ms) on PCD-CT curbs motion blur and prevents calcium-score overestimation | |||
30. Vecsey-Nagy et al. 2025 | J Cardiovasc Comput Tomogr. | Monte Carlo cost-effectiveness model | 55 coronary lesions (diagnostic dataset); simulated 15.000 pts | UHR PCD-CT CCTA (UHR) vs. EID-CT | Projected decrease by 18.9% in downstream functional tests, 6% decrease in ICAs, 9.4% decrease in major complications; cost saving ≈ USD 795/patient, USD 11.9 M overall | UHR PCD-CT CCTA saves costs by reducing follow-up tests and complications in stable chest pain evaluation | |||
31. Zhao et al. 2025 | Quant Imaging Med Surg. | Prospective low-dose vs. standard CAC-CT | 105 pts | Low-dose chest PCD-CT; 3 and 1.5 mm; QIR 0–4 | Sensitivity of 96%–100%, specificity of 100%; ICC of 0.983–0.993; dose reduction of 56% (1.0 vs. 2.3 mGy, P < 0.001); best agreement at LD 1.5 mm-QIR1 | Low-dose 1.5-mm QIR1 PCD-CT chest scan delivers accurate CACS while halving radiation | |||
PCD-CT, photon-counting computed tomography; UHR, ultra-high resolution; HR, high resolution; VMIs, virtual monoenergetic images; DECT, dual-energy computed tomography; CCTA, coronary computed tomography angiography; ECG, electrocardiogram; AUC, area under the curve; pts, patients; PCAT, pericoronary adipose tissue; LCA, left coronary artery; RCA, right coronary artery; VMI, virtual monoenergetic imaging; EID-CT, energy-integrating detector computed tomography; CNR, contrast-to-noise ratio; BMI, body mass index; CTDI, computed tomography dose index; mGy, milligray; CAD-RADS, coronary artery disease reporting and data system; ME, multi-energy; HRV, heart rate variability; kVp, kilovolt peak; CP, calcified plaque; LAP, low-attenuation plaque; HU, Hounsfield unit; T3D, three-dimensional threshold-based segmentation; VNI, virtual non-iodine; CAC, coronary artery calcium; TNC, true non-contrast; CTDIvol, computed tomography dose index volume; DLP, dose-length product; mSv, millisievert; IQ, image quality; CM, contrast media; EAT, epicardial adipose tissue; ICC, intraclass correlation coefficient; CI, confidence interval; CACS, coronary artery calcium scoring; RMSE, root mean square error; ICA, invasive coronary angiography; FFR, fractional flow reserve; ΔCT-FFR, change in computed tomography fractional flow reserve; PPV, positive predictive value; NPV, negative predictive value; DL, deep learning; AVC, aortic valve calcium; MAC, mitral annular calcium; ms, millisecond; LD, low dose; QIR, quantum iterative reconstruction; 3D QCA, three-dimensional quantitative coronary angiography; revasc., revascularization.
In a large retrospective routine-practice cohort (n = 7.833), per-patient specificity with PCD-CT was 98% and 93% with EID-CT, positive predictive value was 83% and 63%, invasive coronary angiography (ICA) referral was 9.9% and 13.1%, and revascularization yield was 43.4% and 35.5%, respectively. In a high-risk cohort with heavy calcification or stents (n = 68), sensitivity and specificity were 96% and 84%, respectively. Two UHR studies reported a mean stenosis-measurement error of 6% and a vessel-level AUC of up to 0.99.,
Low-dose protocols achieved diagnostic image quality at a CTDIvol of 1.72 mGy (DLP:29.1 mGy·cm; effective dose:0.41 mSv), with >95% of segments rated diagnostic. A prospective comparison for calcium scoring showed a 56% dose reduction (1.0 vs. 2.3 mGy) with 1.5-mm slices and low-strength iterative reconstruction. Contrast-saving protocols delivered diagnostic CCTA with 30 mL of iodinated agent using 50-keV reconstructions, and preserved image quality after 40% contrast reduction using 45-keV reconstructions. Kernel and iterative-reconstruction optimization maintained a coronary CNR with finer matrices., An energy-sweep analysis (40–180 keV) documented systematic shifts in quantified plaque components across keV levels.
Virtual non-contrast (VNC) approaches for calcium scoring showed high agreement with true non-contrast (TNC) scans [intraclass correlation coefficient (ICC): 0.98; kappa (κ): 0.88] and contributed to dose reduction. Additional evaluations reported risk-category misclassification for low-density calcium,, with improved agreement using thin-slice reconstructions and higher tube potentials.
Functional and data-driven analyses included on-site CT fractional flow reserve (FFR) with 100% negative-predictive value and a projected reduction of invasive angiography in 39% of cases, deep-learning stenosis detection with a vessel-level AUC of 0.92, and radiomics of pericoronary adipose tissue and plaque texture differentiating hypercholesterolemia and coronary disease status.,,
A Monte Carlo economic model estimated reductions in downstream functional testing (18.9%), invasive angiography (6.0%), and major complications (9.4%), with an approximate cost saving of USD 800 per patient in stable chest pain pathways.
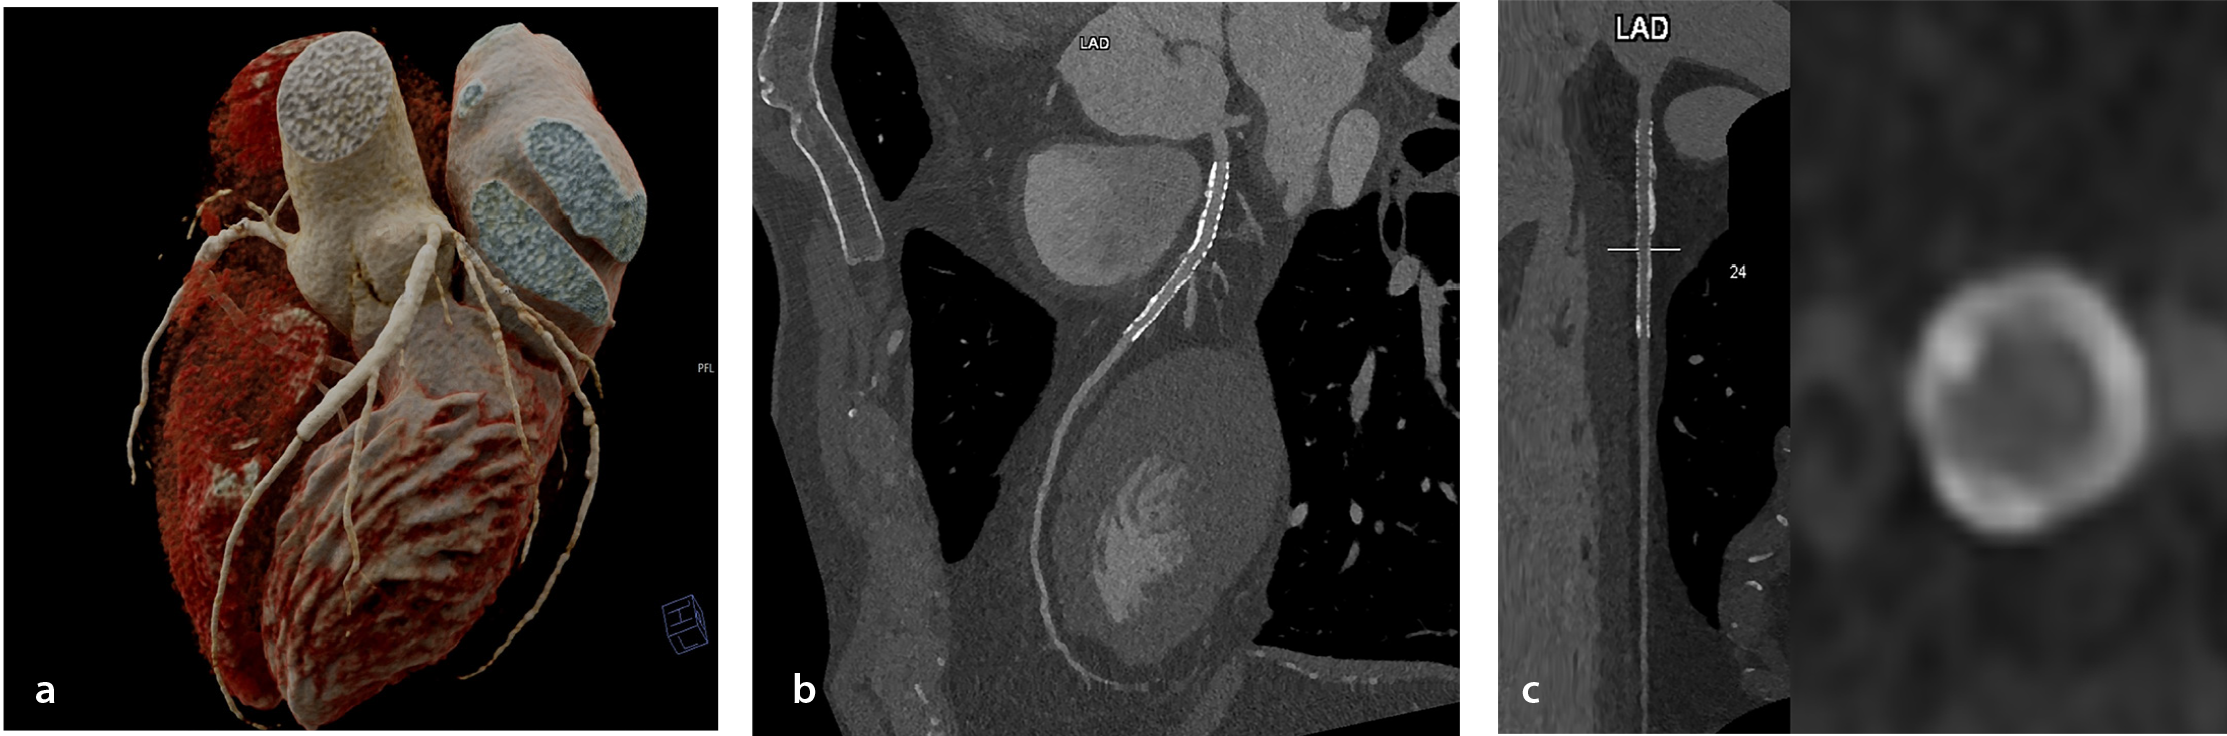
presents the CCTA of a patient with a stent in the left anterior descending artery obtained with PCD-CT in our center.
Myocardial tissue characterization
Four clinical studies evaluated PCD-CT against cardiovascular magnetic resonance imaging (MRI) for late iodine enhancement (LIE) and/or extracellular volume (ECV) mapping (). In this review, LIE denotes CT-based delayed-phase iodine-related myocardial hyperenhancement acquired 5–10 minutes after iodinated contrast and quantified on iodine maps/VMIs; it is analogous to -but distinct from- cardiovascular magnetic resonance (CMR) late gadolinium enhancement (LGE).
Table 2. Photon-counting CT studies related to myocardial tissue characterization
Author | Journal | Study design | Cohort | Imaging | Results | Conclusion |
1. Gkizas et al. 2025 | Diagn Interv Imaging. | Retrospective CT–MRI comparison | 32 pts | Late iodine enhancement PCD-CT (DL product: 96 ± 32 mGy·cm); ECV maps | Global ECV PCD-CT of 29.4% ± 4.5% vs. MRI of 30.0% ± 4.1% (P = 0.69); r: 0.82 with LGE; AUC of 0.95 at a 26.9% threshold | PCD-CT iodine-derived ECV quantifies acute myocarditis accurately at a low dose, matching MRI |
2. Klambauer et al. 2025 | Invest Radiol. | Prospective CT–MRI comparison | 17 pts (24 CT/MRI pairs) | Spectral dual-source PCD-CT LE (5 min delay); atlas-map ECV | Acute κ: 0.832 (CT vs. LGE MRI), κ: 0.944 vs. LGE + edema; follow-up κ: 0.956 | PCD-CT late-enhancement closely matches MRI for SCAD, aided by novel atlas ECV maps |
3. Popp et al. 2025 | Invest Radiol. | Cohort comparison with CMR reference | 30 pts cardiac amyloidosis | First-gen PCD-CT CCTA + delayed phase; single-energy vs. dual-energy ECV methods | SE-PCD-CT ECV not different from CMR (mean diff: 0.43, P = 1.00); DE-PCD-CT slightly lower (-2.24, P = 0.04); both r ≈ 0.89 vs. CMR | PCD-CT simultaneously quantifies myocardial ECV (in tight agreement with CMR) and extensive CAD burden in amyloidosis |
4. Tremamunno et al. 2025 | Eur Radiol. | Retrospective analysis of a prospective cohort; diagnostic-accuracy study vs. LGE-MRI | 27 pts and 459 myocardial segments | Dual-source PCD-CT, ECG-triggered sequential (5 min post-contrast); 120 kVp, 144 × 0.4-mm collimation; iodine maps reconstructed with Qr40 kernel + iterative recon | Per-patient: sens of 100%/91.7%, spec of 73.3%/80.0%, acc of 85.2% • Per-segment: sens of 74.7%/66.7%, spec of 94.9%/96.4%, acc of 91% • Inter-reader κ: 0.70 (patient), 0.63 (segment) | PCD-CT iodine maps deliver high accuracy and substantial agreement for detecting myocardial late enhancement, suggesting a viable alternative when MRI is contraindicated |
CT, computed tomography; MRI, magnetic resonance imaging; pts, patients; PCD-CT, photon-counting detector computed tomography; DL, dose-length; mGy·cm, milligray– centimeter; ECV, extracellular volume; LGE, late gadolinium enhancement; AUC, area under the curve; LE, late enhancement; κ, kappa coefficient; SCAD, spontaneous coronary artery dissection; CMR, cardiovascular magnetic resonance; SE-PCD-CT, single-energy photon-counting computed tomography; DE-PCD-CT, dual-energy photon-counting computed tomography; CCTA, coronary computed tomography angiography; r, correlation coefficient; acc, accuracy; spec, specificity; sens, sensitivity; kVp, kilovolt peak; mm, millimeter; Qr, quantum reconstruction.
In a diagnostic accuracy study of 27 patients (459 myocardial segments), Tremamunno et al. used dual-source PCD-CT with electrocardiogram (ECG)-triggered sequential acquisition 5 minutes post-contrast (120 kVp; 144 × 0.4 mm collimation; iodine maps reconstructed with Qr40 and iterative reconstruction). For two readers, per-patient sensitivity was 100% and 91.7%, specificity was 73.3% and 80.0%, and accuracy was 85.2%. Per-segment sensitivity was 74.7% and 66.7%, specificity was 94.9% and 96.4%, and accuracy was 91%. Inter-reader agreement was κ = 0.70 at the patient level and κ = 0.63 at the segment level.
In a prospective series of 17 patients (24 CT/MRI pairs), Klambauer et al. performed spectral dual-source PCD-CT with a 5-minute delayed LIE and atlas-based ECV mapping. Agreement with LGE-MRI was κ = 0.832 in the acute setting; agreement with combined LGE + edema was κ = 0.944; and at 3-month follow-up, κ = 0.944.
In 30 patients with systemic amyloidosis, Popp et al. used first-generation PCD-CT with CCTA and a delayed phase. Global ECV was 42.93% ± 10.14% (CMR), 42.51% ± 9.07% [single energy (SE)], and 40.69% ± 9.24% [dual energy (DE)]. Compared with CMR, SE showed a mean difference of 0.43% [95% confidence interval (CI): -1.83 to 2.68], whereas DE was -2.24% (95% CI: -4.42 to -0.06); DE vs. SE was -1.82% (95% CI: -2.70 to -0.94). Bland–Altman analysis: the mean bias for DE vs. CMR was -2.28% (limits of agreement: -11.16 to 6.59); for SE vs. CMR, it was -0.42% (-9.77 to 8.92); and for DE vs. SE, it was -1.82% (-5.46 to 1.83). Both CT approaches correlated strongly with CMR (r: 0.892 for DE; r: 0.882 for SE).
In a retrospective CT–MRI comparison of 32 patients with acute myocarditis, Gkizas et al. reported a DLP of 96 ± 32 mGy·cm. The global ECV on PCD-CT was 29.4% ± 4.5% and 30.0% ± 4.1% on CMR (P = 0.69); correlation with LGE was r: 0.82, and the AUC for segment-level inflammation was 0.95 at a 26.9% threshold.
Structural heart and valvular assessment
Six clinical studies () assessed PCD-CT across components of transcatheter aortic valve replacement/implementation (TAVR/TAVI) evaluation, including access planning, annulus sizing, valve-calcium quantification, and concomitant coronary assessment.
Table 3. Photon-counting CT studies related to structural heart and valvular diseases
Author | Journal | Study Design | Cohort | Imaging | Results | Conclusion | |||||
|---|---|---|---|---|---|---|---|---|---|---|---|
1. Brendel et al. 2024 | Diagn Interv Imaging. | Retrospective, single-center, paired PC-CCTA ± FFR vs. ICA in TAVR work-up | 260 pts | Dual-source PCD-CT CCTA, AI stenosis (CorEx) and FFR (Spimed-AI) | PC-CCTA ≥50%: sens of 96.0%, spec of 68.7%, AUC of 0.82; FFR ≤ 0.8: sens of 96.8%, spec of 87.3%, AUC of 0.92; FFR could avoid ICA in 46.5% vs. 37.3% | AI-derived FFR on PCD-CT outperforms diameter stenosis, reducing invasive angiography during TAVR assessment | |||||
2. Dirrichs et al. 2024 | Acad Radiol. | Retrospective comparative cohort | 300 pts (202 PCD-CT, 100 DSCT) | Aorto-ilio-femoral contrast CT for TAVI; PCD-CT vs. dual-source EID-CT | SNR of 33 ± 10.5 vs. 47.3 ± 16.4; CNR of 47.3 ± 14.8 vs. 59.3 ± 21.9 (PCD-CT < DSCT, P < 0.001), yet visual quality of 4.8 vs. 3.3 (P < 0.001); suitability of 99% vs. 85%; eRD of 8.8 ± 4.5 vs. 15.3 ± 5.8 mSv | Despite lower raw SNR/CNR, PCD-CT markedly improves subjective quality and halves radiation for TAVI planning | |||||
3. Feldle et al. 2024 | Sci Rep. | Retrospective diagnostic-accuracy study VNI vs. TNC | 123 pts (56 with AV calcification) | ECG-gated cardiac PCD-CT; 70 keV VNI vs. 70 keV TNC reference | Sens/Spec/Acc of 69%/100%/85% (prospective gating); r: 0.983–0.986 with TNC (P < 0.001) | VNI PCD-CT accurately scores aortic-valve calcification, suggesting TNC can be omitted in AV calcification work-up | |||||
4. Hagar et al. 2024 | Int J Cardiovasc Imaging. | Retrospective paired-scan comparison (pre-TAVR) | 64 pts | Dual-source PCD-CT: UHR-CTA (120 × 0.2 mm) vs. high-pitch spiral CTA (144 × 0.4 mm) | Dose of 12.6 (UHR) vs. 4.1 mSv (HPS); annulus IQ median of 4 vs. 3 (P < 0.001); AAA strongly correlated (r²: 0.857); 91% identical valve sizing | Both PCD-CT modes give reliable aortic-annulus sizing; HPS halves the dose but inferior IQ may mis-size valves when image quality drops | |||||
5. Sharma et al.2024 | Int J Cardiovasc Imaging. | Pre-TAVI HR vs. UHR vs. adj-UHR PCD-CT vs. QCA | 60 pts | Dual-source PCD-CT: HR of 120 kV, UHR of 120 kV, adj-UHR of 90 kV/IQ65 | Per-pt AUC: HR of 0.57, UHR of 0.80, adj-UHR of 0.80; per-vessel AUC of 0.73, 0.69, 0.87 (UHR vs. adj-UHR P = 0.04) | Low-kV adjusted UHR PCD-CT boosts vessel-level CAD detection during TAVI planning without extra dose | |||||
6. Yang et al. 2024 | Eur J Radiol. | Prospective ECG-gated high-pitch vs. reference | 30 prospective + 30 matched controls | High-pitch PCD-CT ECG-gated (30% R–R); annulus sizing | Strong correlation with spiral CT (r ≥ 0.94; P ≥ 0.09); CTDI of 4.52 vs. 24.10 mGy (P < 0.001); systolic capture of 90% vs. 50% | ECG-gated high-pitch PCD-CT accurately sizes aortic annulus while slashing dose five-fold | |||||
PCD-CT, photon-counting computed tomography; PC-CCTA, photon-counting coronary computed tomography angiography; FFR, fractional flow reserve; ICA, ınvasive coronary angiography; TAVR, transcatheter aortic valve replacement; AI, artificial intelligence; CCTA, coronary computed tomography angiography; DSCT, dual-source computed tomography; CT, computed tomography; TAVI, transcatheter aortic valve implantation; EID-CT, energy-integrating detector computed tomography; SNR, signal-to-noise ratio; CNR, contrast-to-noise ratio; eRD, effective radiation dose; mSv, millisievert; VNI, virtual non-iodine; TNC, true non-contrast; AV, aortic valve; ECG, electrocardiogram; keV, kiloelectronvolt; UHR, ultra-high resolution; mm, millimeter; HPS, high-pitch spiral; IQ, ımage quality; AAA, aortic annulus area; r², coefficient of determination; HR, high resolution; adj-UHR, adjusted ultra-high resolution; QCA, quantitative coronary angiography; kV, kilovolt; IQ65, image quality index 65; R-R, R–R interval (cardiac cycle); CTDI, computed tomography dose index.
In a retrospective comparative cohort of 300 patients (202 PCD-CT; 100 dual-source EID-CT), Dirrichs et al. performed aorto-ilio-femoral contrast CT for TAVI. The SNR was 33 ± 10.5 vs. 47.3 ± 16.4, and the CNR was 47.3 ± 14.8 vs. 59.3 ± 21.9 (both P < 0.001). The visual image-quality scores were 4.8 vs. 3.3 (P < 0.001), suitability for TAVI planning was 99% vs. 85%, and the effective radiation dose was 8.8 ± 4.5 vs. 15.3 ± 5.8 mSv.
In a prospective study with 30 patients (plus 30 matched controls), Yang et al. implemented ECG-gated high-pitch PCD-CT at 30% R–R for annulus sizing. Correlation with spiral CT was strong (r ≥ 0.94). Mean paired differences (bias) with 95% CIs between high-pitch PCD-CT and spiral CT were 0.16 mm (-0.10, 0.42) for mean diameter, 0.22 mm (-0.70, 1.13) for the perimeter, and 5.35 mm² (-22.02, 32.72) for the annular area; Bland–Altman plots showed minimal bias. Additionally, CTDI was 4.52 vs. 24.10 mGy (P < 0.001); systolic capture occurred in 90% vs. 50%.
In a paired-scan comparison of 64 pre-TAVR candidates, Hagar et al. compared UHR PCD-CT CTA (120 × 0.2 mm) with high-pitch spiral CTA (144 × 0.4 mm). The effective dose was 12.6 (UHR) vs. 4.1 mSv (high pitch); annulus image-quality scores were median 4 vs. 3 (P < 0.001). Area-derived annulus measurements were highly correlated (r²: 0.857), and prosthesis size selection was identical in 91% of patients; the distribution of ±1 size and ≥±2 sizes was not reported in the paper.
In 123 patients (56 with aortic-valve calcification), Feldle et al. evaluated ECG-gated cardiac PCD-CT with 70 keV virtual non-iodine (VNI) images against 70 keV TNC. Sensitivity, specificity, and accuracy were 69%, 100%, and 85%, respectively, under prospective gating. Correlation between VNI-derived and TNC Agatston scores was r: 0.983–0.986 (P < 0.001).
In a retrospective single-center cohort of 260 patients during TAVR workup, Brendel et al. performed dual-source PCD-CT CCTA with artificial intelligence (AI) stenosis quantification (CorEx) and AI-derived FFR (Spimed-AI), both referenced to ICA. For ≥50% stenosis, sensitivity was 96.0%, specificity was 68.7%, and the AUC was 0.82. For FFR ≤ 0.80, sensitivity was 96.8%, specificity was 87.3%, and the AUC was 0.92. Decision analysis indicated that 46.5% vs. 37.3% of cases were classified as not requiring ICA with AI-based FFR vs. diameter-based stenosis.
During TAVI planning in 60 patients, Sharma et al. compared HR (120 kV), UHR (120 kV), and adjusted UHR (90 kV, IQ65) PCD-CT protocols against quantitative coronary angiography. Per-patient AUCs were 0.57 (HR), 0.80 (UHR), and 0.80 (adjusted UHR); per-vessel AUCs were 0.73, 0.69, and 0.87, respectively (UHR vs. adjusted UHR, P = 0.04).
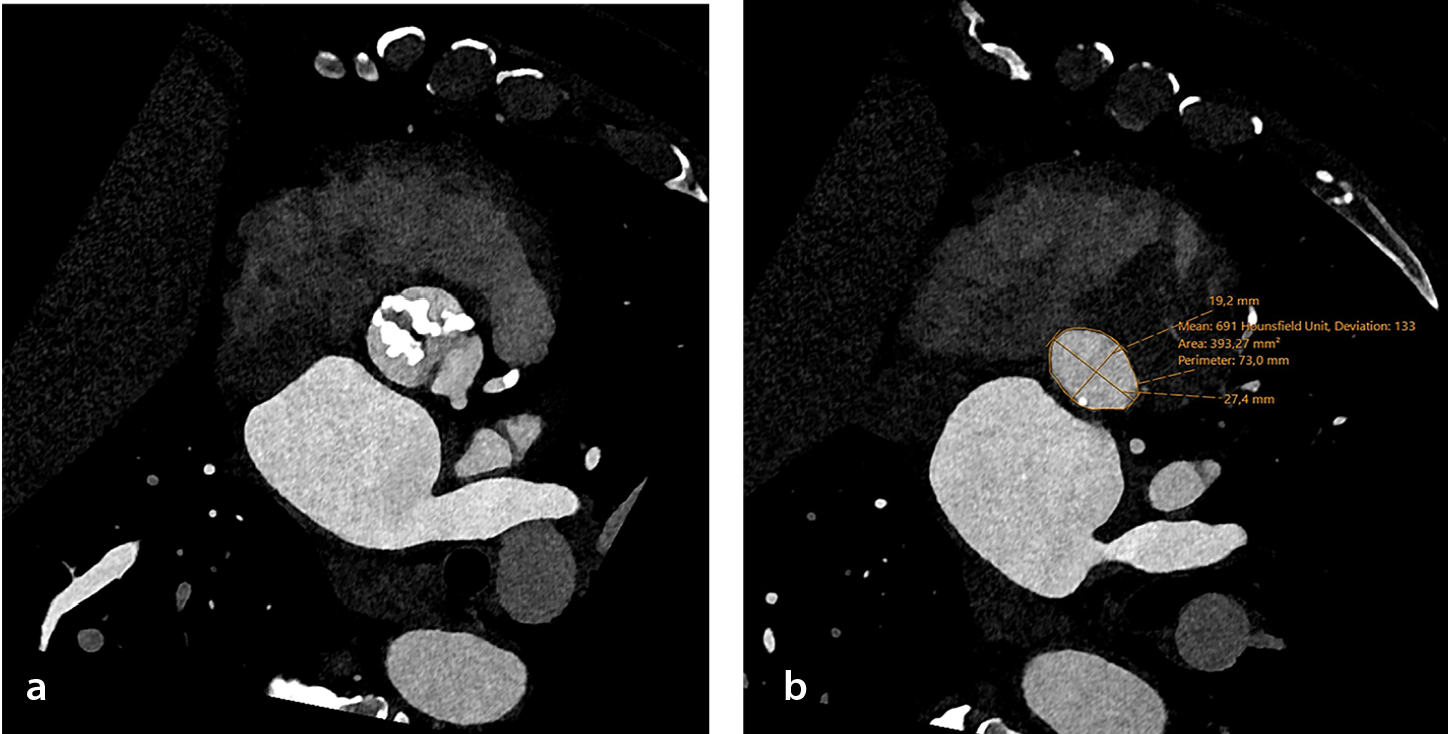
presents the PCD-CT angiography for a patient undergoing evaluation for TAVR.
Pulmonary and cardio-pulmonary functional imaging
Four clinical studies (; n = 447 patients) evaluated PCD-CT for pulmonary and cardiopulmonary functional assessment. Scharm et al. acquired contrast-enhanced inspiratory PCD-CT and expiratory PCD-CT 5 minutes later in 166 patients, producing technically successful functional maps in 84.7% of patients; mean enhancement values were 325 HU for the pulmonary trunk, 260 HU for the left atrium, and 252 HU for the aorta, with per-phase dose indices of approximately CTDI: 3 mGy and DLP: 110 mGy·cm.
Table 4. Photon-counting CT studies related to pulmonary and cardio-pulmonary functional imaging
Author | Journal | Study design | Cohort | Imaging | Results | Conclusion |
1. Scharm et al. 2023 | Radiology. | Retrospective observational | 166 pts (166 inspiratory + expiratory scans) | Contrast-enhanced inspiratory PCD-CT, expiratory PCD-CT 5 min later | 84.7% success; mean HU of the pulmonary trunk 325, LA 260, Ao 252; DLP ≈ 110 mGy·cm/phase; CTDI ≈ 3 mGy; all functional metrics differed between 6 subgroups (P < 0.05) | Two-phase PCD-CT permits simultaneous morphology, ventilation and perfusion mapping at reference-level dose |
2. Saeed et al. 2024 | Acad Radiol. | Retrospective dose-reduction series | 105 pts (35/45/60 mL CM) | High-pitch FLASH PCD-CT CTPA | Subjective quality of 4.6 vs. 4.1 (35 vs. 60 mL, P < 0.001); trunk HU of up to 320–347 (ns); all segmental arteries assessable | Diagnostic CTPA achievable with 35 mL contrast on PCD-CT without quality loss |
3. Yalon et al. 2024 | J Comput Assist Tomogr. | Three-arm comparative cohort (PCD-CT vs. high-pitch and routine DECT) | 150 pts | High-pitch multi-energy PCD-CT pulmonary CTA | CTDIvol of 8.1 mGy vs. 9.6/16.2; highest CT number & CNR (P < 0.001); subjective artery contrast of 4.7 vs. 4.4/4.3; fewer motion artifacts | High-pitch PCD-CT pulmonary CTA delivers superior contrast, fewer artifacts, and lower dose than conventional dual-source protocols |
4. Kerber et al. 2025 | Invest Radiol. | Retrospective comparative | 26 pts | Lung-perfusion PCD-CT iodine maps (mean dose = 1.19 ± 0.33 mSv) | Accuracy of 0.85/0.88 vs. 0.73 (SPECT); sensitivity of 0.90 vs. 0.80; specificity of 0.81/0.88 vs. 0.69; dose reduced to ≈5× vs. SPECT | PCD-CT iodine maps detect CTEPH as accurately as SPECT at one-fifth the dose and correlate with hemodynamics |
PCD-CT, photon-counting computed tomography; HU, Hounsfield unit; LA, left atrium; Ao, aorta; DLP, dose-length product; mGy·cm, milligray–centimeter; CTDI, computed tomography dose index; CM, contrast media; FLASH, fast low-angle shot; CTPA, computed tomography pulmonary angiography; ns, not significant; CTA, computed tomography angiography; CTDIvol, computed tomography dose index volume; CNR, contrast-to-noise ratio; DECT, dual-energy computed tomography; mSv,millisievert; SPECT, single photon emission computed tomography; CTEPH, chronic thromboembolic pulmonary hypertension.
Kerber et al. performed a retrospective comparison in 26 patients who received both PCD-CT iodine maps and single photon emission computed tomography (SPECT)/CT for suspected or known chronic thromboembolic pulmonary hypertension (CTEPH). Using multidisciplinary clinical diagnosis as the reference standard and per-patient CTEPH classification, two blinded PCD-CT readers achieved accuracies of 0.85 (95% CI: 0.66–0.94) and 0.88 (0.71–0.96), with sensitivities of 0.90 (0.60–0.98) and 0.90 (0.60–0.98) and specificities of 0.81 (0.57–0.93) and 0.88 (0.65–0.97). The SPECT/CT consensus had an accuracy of 0.73 (0.54–0.86), sensitivity of 0.80 (0.49–0.94), and specificity of 0.69 (0.44–0.86), and between-modality differences were not significant (P > 0.688). The lobar-level perfusion-defect extent on PCD-CT showed moderate correlations with right-heart catheter measures, and the dose was markedly lower with PCD-CT (1.19 ± 0.33 mSv) than with SPECT/CT (6.34 ± 1.68 mSv).
Saeed et al. conducted a retrospective dose-reduction series of 105 patients undergoing high-pitch fast low-angle shot PCD-CT pulmonary CTA with 35, 45, or 60 mL of contrast. Subjective image quality was 4.6 vs. 4.1 for 35 vs. 60 mL (P < 0.001), pulmonary-trunk attenuation was 320–347 HU, and all segmental arteries were assessable.
Yalon et al. performed an evaluation of a three-arm comparative cohort (n = 150) of multi-energy high-pitch PCD-CT pulmonary CTA compared with high-pitch and routine dual-source DE-CT, reporting a CTDIvol of 8.1 vs. 9.6/16.2 mGy and a CNR (P < 0.001), a subjective artery-contrast score of 4.7/5 vs. 4.4/5 and 4.3/5, and fewer motion artifacts with PCD-CT.
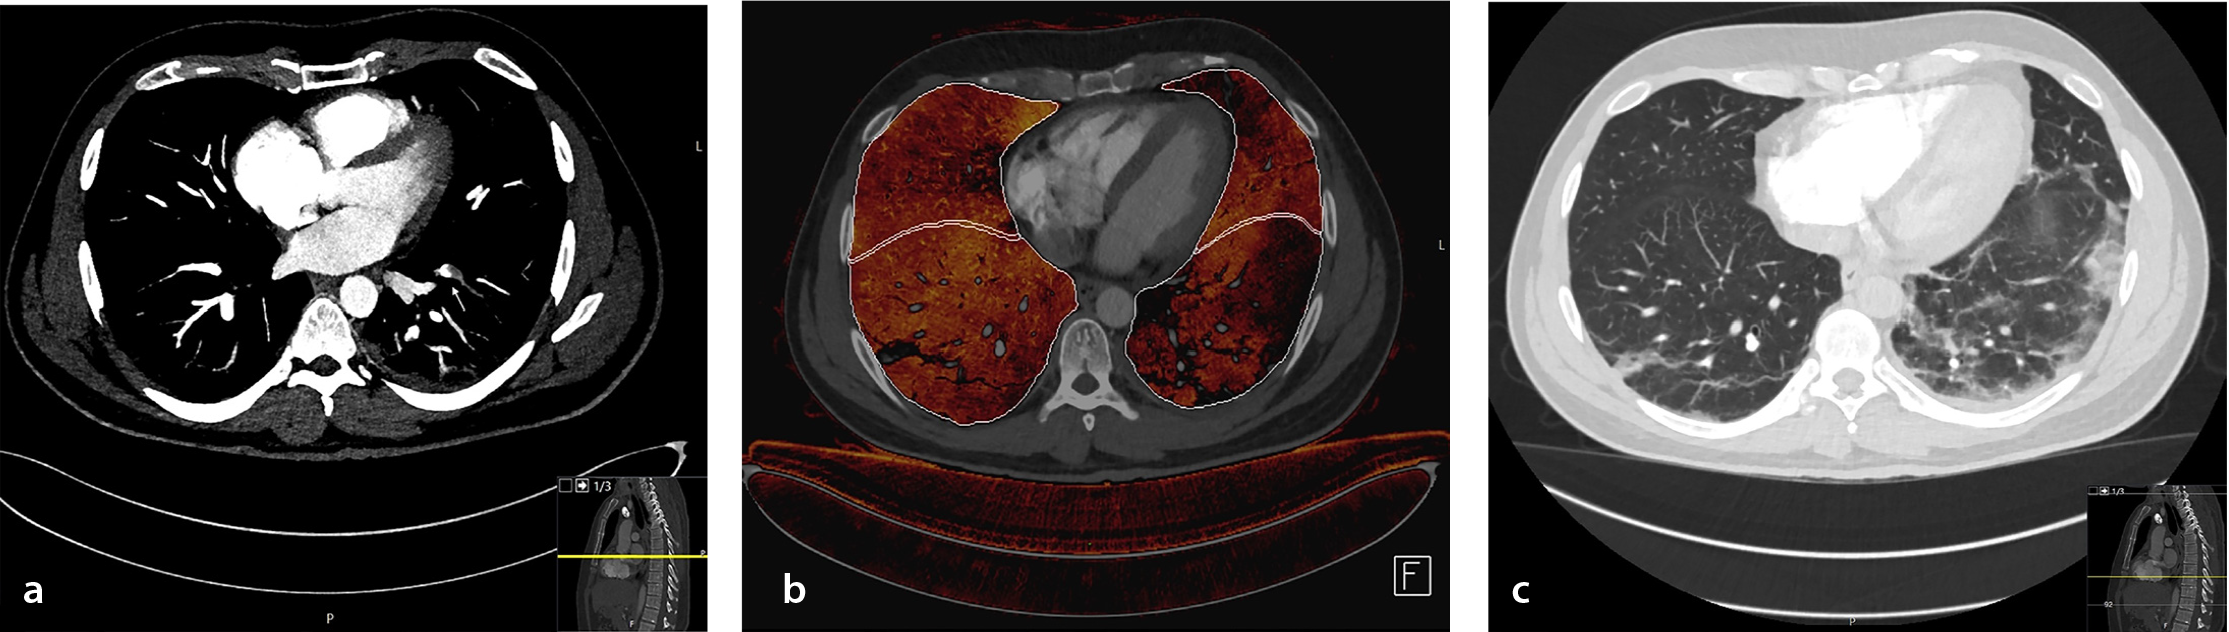
illustrates the use of PCD-CT perfusion maps in a patient with a segmental pulmonary embolism.
Aortic, visceral, and peripheral arterial disease
Fourteen clinical studies (; n = 851 patients) evaluated PCD-CT across the thoracoabdominal aorta, renal–visceral branches, and lower-extremity run-off.
Table 5. Photon-counting CT studies related to aortic, visceral, and peripheral arterial diseases
Author | Journal | Study design | Cohort | Imaging | Results | Conclusion |
|---|---|---|---|---|---|---|
1. Euler et al. 2022 | Invest Radiol. | Intra-individual (same-patient) comparison | 40 pts | High-pitch PCD-CT at 120 kV; VMI of 40–55 keV; matched dose to EID-CT | CNR of 22 ± 7 (40 keV) vs. 17 ± 8 (EID); CNR gain greatest in pts who are overweight (+34%); subjective noise increased at 40–45 keV, overall quality similar | High-pitch PCD-CT aortic CTA with 40–45 keV VMI boosts CNR vs. matched-dose EID-CT, especially in patients who are overweight |
2. Dillinger et al. 2023 | Diagnostics. | Prospective single-arm observational | 20 pts | Arterial-phase PCD-CT; VMIs of 40–110 keV | Peak CNR at 60 keV; peak SNR at 70 keV (ns vs. 60 keV P = 0.294); best subjective quality at 70 keV | 60–70 keV VMIs optimize abdominal-vessel contrast and perceived image quality |
3. Mundt et al. 2023 | BMC Med Imaging. | Retrospective radiomics | 55 pts | First-gen PCD-CT, non-contrast; descending-aorta adipose segmentation | Two GLCM features (ClusterProminence, ClusterTendency) distinguished Agatston score of ≥ 100 vs. 0; ClusterProminence most stable (10-fold CV) | Periaortic adipose texture on PCD-CT correlates with coronary calcium, hinting at inflammatory changes |
4. Hennes et al. 2023 | Diagnostics. | Intra-individual PCD-CT vs. EID-CT | 57 pts | High-pitch PCD-CT of 120 kVp, 55 keV mono-E; EID-CT of 90/100 kVp | SSDE of 4.88 ± 0.48 vs. 6.28 ± 0.50 mGy (P < 0.001); CNR of 41.1 ± 8.7 vs. 27.1 ± 6.7 (P < 0.001); superior overall IQ and luminal contrast on PCD-CT; reduced blooming on EID | PCD-CT aortic CTA halves dose and boosts CNR versus EID-CT, though blooming still favors EID |
5. Rippel et al. 2023 | Eur J Radiol. | Retrospective matched-cohort comparison | 40 pts with PCD-CT vs. 40 pts with EID | Run-off CTA on first-gen PCD-CT; VMI of 40–120 keV | SNR and CNR at 40–60 keV exceeded EID; subjective image quality higher at low keV and not different from EID | Low-keV VMI PCD-CT run-off CTA delivers higher vessel SNR/CNR than low-kVp EID without loss of perceived quality |
6. Dane et al. 2024 | J Comput Assist Tomogr. | Retrospective intra-individual comparison | 50 pts | Portal-venous PCD-CT with 20 mL contrast reduction; 70 keV mono-E recon | No sig. difference vs. EID in hepatic HU, portal-vein HU, noise, SNR or CNR (all P > 0.0016); image quality and metastasis confidence similar; κ: 0.86 (PCD-CT) vs. 0.78 (EID) for metastasis detection | Portal-venous PCD-CT maintains image quality and lesion detection with 20 mL less contrast than weight-based EID-CT |
7. Dane et al. 2024 | J Comput Assist Tomogr. | Retrospective within-patient PCD-CT vs. EI-DECT VNC | 74 pts | Portal-venous PCD-CT VNC compared with prior EI-DECT VNC | Qualitative IQ, noise, small-structure delineation all better on PCD-CT (P < 1×10⁻⁴); lower noise (P = 0.006), higher CNR (P < 0.0001); dose of 9.2 vs. 9.4 mGy (P = 0.06) | PCD-CT-derived VNC images outperform EI-DECT VNC for abdominal imaging without increasing radiation dose |
8. Graafen et al. 2024 | Eur Radiol Exp. | Phantom + prospective patient evaluation | 20 pts + in-vitro tubes | Lower-leg CTA reconstructed at 0.4 mm; kernels Qr36–76; QIR of 2–4 | Phantom: noise increased with kernel sharpness (16→77 HU); sharpness plateau at Qr60; higher QIR cut noise (51→25 HU) without blurring. In vivo: Qr60 + highest QIR gave best overall quality | Sharp kernel Qr60 combined with highest QIR optimizes lower-leg PCD-CT angiography quality |
9. Rippel et al. 2024 | J Endovasc Ther. | Prospective matched-cohort comparison | 50 pts | ECG-gated high-pitch thoracoabdominal PCD-CT; VMI of 40–120 keV | Dose of 4.2 ± 1.4 vs. 7.2 ± 2.2 mGy (P < 0.001); SNR increased at 40 and 70 keV; CNR increased at 40–45 keV; low-keV salvages low-contrast scans | High-pitch PCD-CTA halves radiation and boosts SNR/CNR; low-keV VMI rescues sub-optimal contrast studies |
10. Yalon et al. 2024 | AJR. | Prospective intra-individual comparison | 32 pts | Same-day infrapopliteal PCD-CTA (60 mL contrast) vs. EID-CTA (140 mL) | Fibular perforators: 6.4 ± 3.2 vs. 4.2 ± 2.4 (P < 0.001); sharpness of 3.2 ± 0.5 vs. 1.8 ± 0.5 (P < 0.001); contrast dose decreased by 60% | PCD-CTA improves infrapopliteal vessel visualization and sharpness while halving contrast dose |
11. Ayx et al. 2025 | Eur J Radiol. | Retrospective PCD-CT UHR vs. EICT abdominal CTA | 25 + 25 pts | PCD-CT UHR (abdominal arterial phase) | CTDIvol of 4.7 vs. 7.3 mGy; eff dose of 3.4 vs. 6.5 mSv; higher SNR/CNR (renal P = 0.043); subjective IQ increased (P < 0.0001) | UHR PCD-CT abdominal CTA halves dose and boosts image quality versus energy-integrating CT |
12. Ghibes et al. 2025 | Eur J Radiol. | Retrospective PCD-CTA vs. DSA gold standard | 109 pts and 933 segments | Lower-extremity PCD-CT CTA ± pure-lumen recon | PCD-CT: sens of 91%, spec of 95%, acc of 93%; κ: 0.79–0.83 | PCD-CT CTA shows high accuracy for peripheral-artery stenosis, matching DSA |
13. Ota et al. 2025 | Radiol Med. | Retrospective biomarker study with VNCa maps | 200 pts | Abdominal PCD-CT angiography + VNCa subtraction | PCV AUC of 0.94 vs. ACV 0.90; PCV cut-off at 14.8%–73% sens/99% spec for high CVD risk | PCD-CT-derived%-calcification of abdominal aorta is a strong imaging biomarker for systemic CVD risk |
14. Sala et al. 2025 | Bioengineering. | Retrospective PCD-CT vs. histology | 14 pts | Pre-op PCD-CT in ATAA; wall thickness measured radiologically and pathologically | pc-CT min/max of 1.05/1.69 mm vs. histology of 1.66/2.82 mm; Bland–Altman shows no systematic bias (min of -0.61 mm; max of -1.1 mm) | Preliminary evidence that PCD-CT wall-thickness measurements agree with histology, supporting risk-stratification beyond diameter |
PCD-CT, photon-counting detector computed tomography; VMI, virtual monoenergetic imaging; EID-CT, energy-integrating detector computed tomography; CNR, contrast-to-noise ratio; pts, patients; SNR, signal-to-noise ratio; ns, not significant; GLCM, gray level co-occurrence matrix; CV, coefficient of variation; kVp, kilovolt peak; mono-E, monoenergetic; SSDE, size-specific dose estimate; IQ, ımage quality; CTA, computed tomography angiography; HU, Hounsfield unit; VNC, virtual non-contrast; EI-DECT, energy-integrating dual-energy computed tomography; QIR, quantum iterative reconstruction; Qr, quantum reconstruction; mGy, milligray; TNC, true non-contrast; ECG, electrocardiogram; PCD-CTA, photon-counting detector computed tomography angiography; AJR, American Journal of Roentgenology; UHR, ultra-high resolution; EICT, energy-integrating computed tomography; eff dose, effective dose; mSv, millisievert; acc, accuracy; spec, specificity; sens, sensitivity; DSA, digital subtraction angiography; PCD-CTA, photon-counting computed tomography angiography; VNCa, virtual non-contrast calcium maps; PCV, percent calcified volume; ACV, absolute calcified volume; CVD, cardiovascular disease; ATAA, ascending thoracic aortic aneurysm.
Euler et al. performed an intra-individual comparison (n = 40) at a matched dose using high-pitch PCD-CT with 40–55 keV VMIs and reported a CNR of 22 ± 7 at 40 keV vs. 17 ± 8 on EID-CT, with the greatest CNR gain in patients who were overweight; subjective noise increased at 40–45 keV, whereas overall image quality was similar.
Dillinger et al. prospectively evaluated arterial-phase PCD-CT of the abdomen (n = 20) with VMI reconstructions from 40–190 keV: a cohort CTDIvol of 7.90 ± 3.92 mGy, a DLP of 330.6 ± 198.5 mGy·cm, and an effective dose of 4.92 ± 2.97 mSv (Radimetrics v3.4, ICRP-103 Monte Carlo; verification with k-factors of 0.015 for the abdomen and 0.014 for the chest). The CNR peaked at 60 keV and the SNR at 70 keV (no significant difference vs. 60 keV, P = 0.294), and subjective image quality was rated optimal at 70 keV. Acquisition and reconstruction settings were automatic 100–120 kVp, a pitch of 0.80, and 1-mm VMI in Qr40.
Hennes et al. conducted an intra-individual comparison (n = 57) of ECG-triggered, high-pitch aortic CTA using PCD-CT [120 kVp; 144 × 0.4 mm; VMI 55 keV; kernel Bv36, quantum iterative reconstruction 3 (QIR-3)] and EID-CT with automatic tube voltage selection (ATVS) at 90/100 kVp [effective collimation: 192 × 0.6 mm; Bv36, advanced modeled iterative reconstruction 3 (ADMIRE-3)]. The CTDIvol was 3.95 ± 0.54 (PCD-CT) vs. 4.97 ± 0.57 mGy (EID-CT) (P < 0.001), and the SSDE was 4.88 ± 0.48 vs. 6.28 ± 0.50 mGy (P < 0.001); the DLP and effective dose were not reported. The CNR was 41.11 ± 8.68 vs. 27.05 ± 6.73 (P < 0.001), with higher overall image quality and luminal contrast on PCD-CT; vessel sharpness was similar, whereas blooming and beam hardening were less pronounced on EID-CT.
Rippel et al. (prospective matched-cohort, ECG-gated high-pitch thoracoabdominal CTA; n = 50) reported an exam-level CTDIvol of 4.0 [interquartile range (IQR): 3.1–4.9] vs. 6.5 mGy (5.5–9.7) and a DLP of 288 (207–402) versus 466 mGy·cm (365–681) (both P < 0.001). On PCD-CT, the SNR was higher at 40 and 70 keV VMIs, and the CNR was higher at 40–45 keV (each P < 0.001) than with EID-CT, and low-keV VMIs salvaged low-contrast studies (diagnostic acceptability 50% → 75% at 40 keV). Acquisition and reconstruction: PCD-CT at 120 kVp, 144 × 0.4-mm collimation, 3.2 pitch, 0.25-s rotation time, Bv36 + QIR-3; EID-CT with ATVS at 100/120/140 kVp, 123 × 0.6-mm collimation, 3.2 pitch, 0.28-s rotation time, I26s + ADMIRE-3. The effective dose was not reported.
In a retrospective matched run-off CTA cohort (40 PCD-CT vs. 40 EID-CT), the exam-level CTDIvol and DLP were 3.9 (IQR: 3.0–7.6) vs. 3.5 mGy (2.4–5.7) (P = 0.024) and 499 (353–1060) versus 456 mGy·cm (268–753) (P = 0.029), respectively. The SNR on PCD-CT exceeded EID-CT for 40–70 keV VMIs, whereas the CNR exceeded EID-CT at 40–45 keV (vs. 80 kVp EID) and 40–50 keV (vs. 100 kVp EID). Subjective image quality was optimal at 40–60 keV and not significantly different from EID-CT overall. Acquisition and reconstruction: PCD-CT at 120 kVp (QuantumPlus; 144 × 0.4-mm collimation, 0.8 pitch, Qr36 + QIR-3, 1-mm slices, 512 × 512 matrix) with VMI 40–120 keV; EID-CT with ATVS at 80/100 kVp (128 × 0.6 mm, 0.5 pitch, I26s + ADMIRE-3), with identical slice thickness and matrix.
An in vitro/in vivo study (n = 20) of lower-leg PCD-CT reconstructed at 0.4-mm isotropic resolution found that a sharp quantitative kernel (Qr60) combined with the highest QIR level (QIR-4) best reduced noise without degrading edge definition, yielding the highest qualitative scores. In vivo CTDIvol at the lower-leg level was 2.51 mGy (IQR: 2.50–2.57); the DLP, SSDE, and effective dose were not reported. Acquisition/reconstruction: 120 kVp, CARE Dose4D (image-quality index 145), VMI 55 keV, 512 × 512 matrix, field of view of 205 × 205 mm, kernels Qr44/Qr60/Qr72 with QIR-2/-3/-4; inter-reader reliability was substantial overall (Krippendorff’s α: 0.70–0.71) and excellent for noise (α: 0.84–0.86).
In a portal-venous intra-individual comparison (n = 50), PCD-CT used 20 mL less intravenous contrast than weight-based EID-CT (90.9 ± 23.0 vs. 111.0 ± 24.0 mL; P < 0.001) and, at 70-keV VMIs, showed no significant differences in hepatic or portal-vein attenuation, noise, SNR, or CNR (all P > 0.0016), with similar qualitative scores and metastasis-detection confidence [odds ratios: 0.58 (95% CI: 0.33–1.01), 1.25 (0.61–2.56), and 1.17 (0.54–2.52), respectively]. Exam-level dose metrics were a CTDIvol of 9.4 ± 4.0 vs. 11.1 ± 7.4 mGy (P = 0.005) and a DLP of 458.7 ± 219.9 vs. 534.6 ± 391.7 mGy·cm (P = 0.01); the effective dose was not reported. Inter-reader agreement for metastasis identification was κ = 0.86 (95% CI: 0.70–1.00) for PCD-CT and 0.78 (0.59–0.98) for EID-CT. Acquisition/reconstruction (fairness): PCD-CT at 120 kVp, 144 × 0.4 mm, CARE Dose4D/Care kV (IQ 145), 70-keV VMI, Br44; EID-CT at 120 kVp, Br44; 4-mm axial and 3-mm coronal/sagittal reconstructions.
In a within-patient comparison (n = 74) of portal-venous VNC images, PCD-CT vs. EID-CT showed an exam-level CTDIvol of 9.2 ± 3.5 vs. 9.4 ± 9.0 mGy (P = 0.06) and a DLP of 417.9 ± 162.8 vs. 523.4 ± 290.9 mGy·cm (P = 0.026) (32-cm phantom for both). Qualitatively, PCD-CT VNC had higher overall image quality, lower perceived noise, better small-structure delineation, improved noise texture, and fewer artifacts (all P < 0.00001). Quantitatively, PCD-CT VNC had lower attenuation (all P < 0.05), lower noise (P = 0.006), and a higher CNR (P < 0.0001–0.04); the SNR was lower for enhancing structures (reflecting greater iodine removal) but higher in fat. Acquisition/reconstruction (fairness): PCD-CT 120 kV (QuantumPlus), 144 × 0.4 mm, 0.8 pitch, 0.5-s rotation, CARE Dose4D/CARE kV; EI-DECT of 80–90/Sn150 kV, 0.6 pitch, 0.5-s rotation; VNC recon at 4 mm (Br44) for both.
For infrapopliteal evaluation, a same-day intra-individual study (n = 32) used 60.0 ± 11.0 mL contrast on PCD-CT vs. 139.6 ± 11.8 mL on EID-CT and reported an exam-level CTDIvol of 6.6 ± 2.2 vs. 4.6 ± 3.0 mGy (DLP and effective dose not reported). Acquisition/reconstruction parameters were as follows: PCD-CT UHR mode 120 kV, 120 × 0.2-mm collimation, 0.5 pitch, 0.25-s rotation, 1,024 matrix, Br68, IR-3; EID-CT SE with CARE kV (variable kV), 192 × 0.6-mm collimation, 0.4 pitch, 0.5-s rotation, 512 matrix, Bv44, IR-2. PCD-CT yielded more visualized fibular perforators (R1: 6.4 ± 3.2 vs. 4.2 ± 2.4, P < 0.001; R2: 8.8 ± 3.4 vs. 7.6 ± 3.3, P = 0.04) and greater arterial sharpness (both readers 3.2 vs. 1.7–1.8, P < 0.001), with fewer total occlusions for one reader (0.5 ± 1.3 vs. 0.9 ± 1.7, P = 0.04) and similar subjective noise.
In abdominal arterial-phase imaging, a retrospective comparison (25 + 25 patients) of UHR PCD-CT vs. EID-CT reported a median CTDIvol of 4.7 (IQR: 3.9–5.1) vs. 7.3 mGy (4.6–12.6) and a DLP of 229 (187–262) vs. 295 mGy·cm (233–595); the effective dose was 3.4 (2.8–3.9) vs. 4.4 mSv (3.5–8.9), calculated as DLP × 0.015 mSv·mGy-1·cm-1. PCD-CT showed higher SNR/CNR (significant for renal arteries, P = 0.0432) and higher subjective image quality (P < 0.0001). Acquisition/reconstruction details: PCD-CT UHR 120 kV, 0.25-s rotation, 0.8 pitch, 0.2-mm collimation; 0.6 /0.6 mm axial reconstruction, Bv40 kernel; EID-CT 80–140 kV with automatic dose modulation, 0.28-s rotation, 0.6 pitch, 0.6-mm collimation; I30f/Bv38 reconstruction; non-ECG gated.
Diagnostic performance against digital subtraction angiography (DSA) was assessed per segment in 109 patients (933 arterial segments): sensitivity was 91% (95% CI 87–94), specificity was 95% (92–96), and accuracy was 93% (≈95% CI: 91–95) overall; territory-level accuracies were 98% (iliac), 92% (femoro-popliteal), and 93% (calf). Inter-reader agreement was good (weighted κ: 0.791; κ: 0.829 for pure-lumen reconstruction). Agreement with DSA grading was κ: 0.905 (CTA) and κ: 0.825 (pure lumen); 95% CIs for κ were not reported.
Exploratory biomarker research included a radiomics study (n = 55) in which two gray-level co-occurrence matrix features from periaortic adipose tissue distinguished Agatston ≥ 100 vs. 0; ClusterProminence showed the most stable performance under 10-fold cross-validation. In 200 patients, Ota et al. derived %-calcification on VNCa maps of the abdominal aorta with an AUC of 0.94 (vs. an ACV AUC of 0.90); a 14.8% cut-off yielded 73% sensitivity and 99% specificity for high cardiovascular-risk classification.
A histology-matched study of ascending thoracic aortic aneurysms (n = 14) compared per-patient minimum and maximum aortic-wall thickness on PCD-CT with ex vivo histology. ECG-gated UHR-CTA of the aortic root (120 × 0.2-mm collimation; 66-ms temporal resolution) was followed by non-gated thorax–abdomen–pelvis CTA (144 × 0.4-mm collimation). The effective-dose model, CTDIvol, DLP, and SSDE were not reported. The results (unit of analysis = patient-level paired measures) showed a PCD-CT mean minimum/maximum wall thickness of 1.05/1.69 mm versus histology of 1.66/2.82 mm. Bland–Altman (PCD-CT−histology) analysis revealed a mean bias of −0.61 (minimum) and −1.10 mm (maximum); the authors stated no systematic bias, and numerical limits of agreement were not tabulated. Inter-/intra-observer ICCs were not performed or reported.
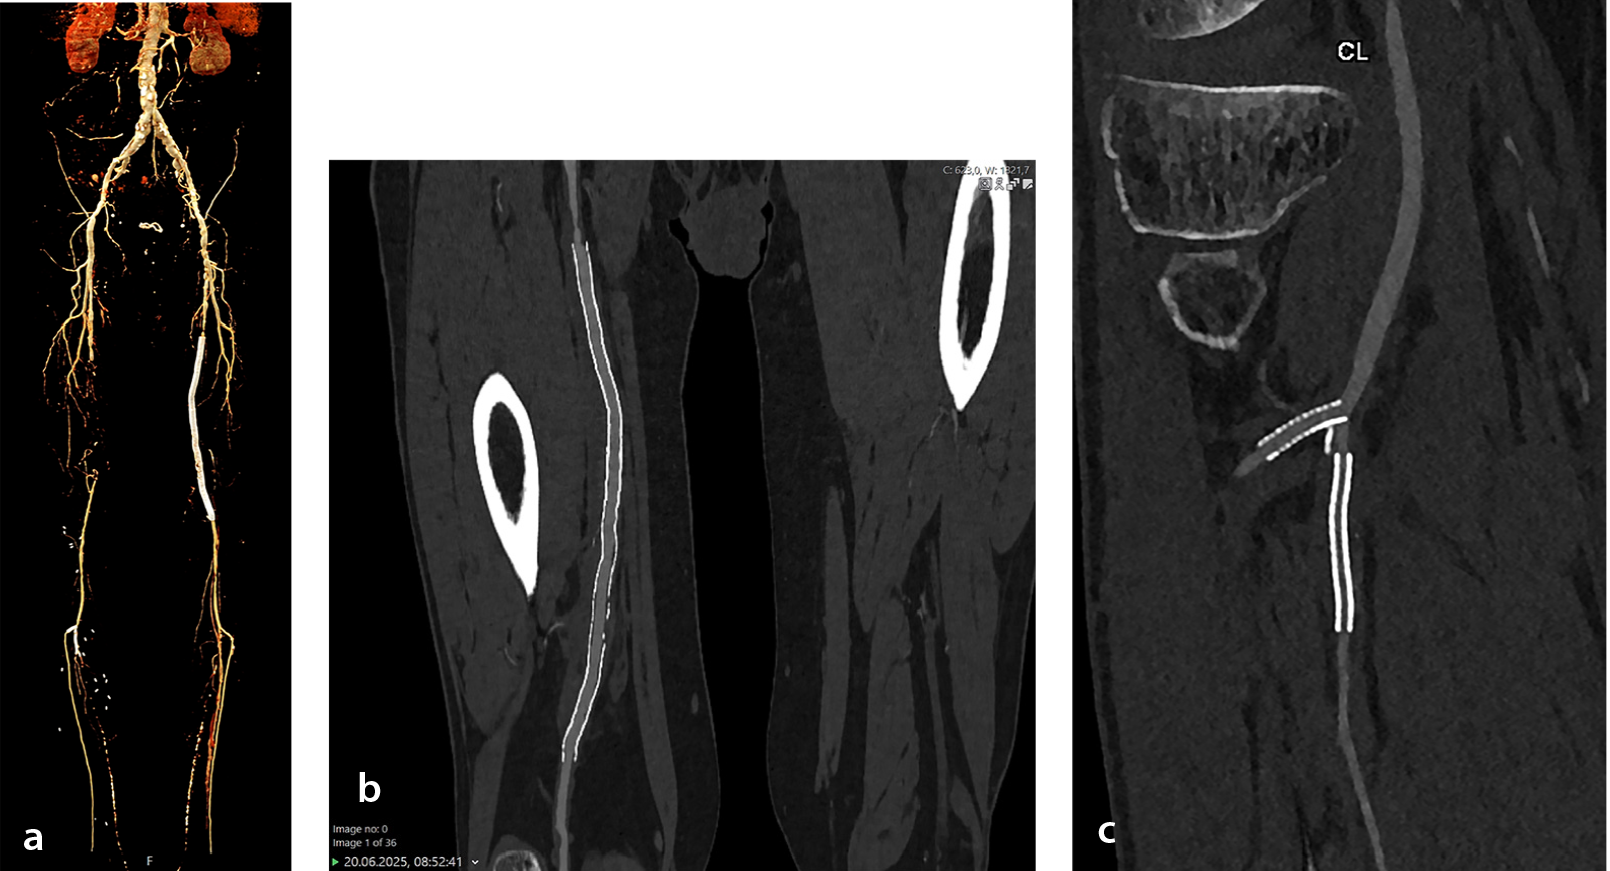
presents aortic PCD-CT and peripheral angiography in a patient with an iliac stent and multiple stenotic segments in the peripheral arterial system.
Discussion
Evidence summary
Fifty-nine clinical studies published between January 2021 and September 1, 2025, evaluated PCD-CT across the cardiovascular spectrum: 31 coronary, 14 aortic–visceral–peripheral, 4 pulmonary/cardiopulmonary functional, 4 myocardial tissue characterization, and 6 structural-heart/valvular-planning investigations. Across domains, the included studies frequently reported at least one advantage of PCD-CT over EID-CT, including higher spatial resolution at a routine or reduced dose, opportunities for radiation and contrast savings, and robust diagnostic performance in real-world cohorts. Reported examples include vessel-level AUCs of up to 0.99 with UHR modes; reductions in CTDIvol of approximately 40%–60% in matched coronary comparisons; effective doses as low as 0.41 mSv for selected coronary protocols; and 40%–60% contrast-volume reductions in thoracoabdominal CTA, infrapopliteal run-off, and pulmonary embolism protocols without loss of diagnostic confidence.
In routine coronary practice, a large comparative cohort of 7.833 examinations reported an increase in per-patient specificity from 93% to 98% and a reduction in invasive angiography referrals from 13.1% to 9.9%. In the peripheral circulation, diagnostic performance approached that of DSA, with sensitivity around 91% and specificity around 95%. Quantitative capabilities extend beyond morphology: VNC calcium scores have shown ICCs of 0.97–0.99 compared with TNC; iodine-derived ECV estimates differ from cardiac MRI by less than 2% in selected studies; and decision-analytic modeling suggests potential cost savings by reducing downstream testing.
Context within prior syntheses
Since 2023, several narrative or semi-structured reviews have highlighted the clinical promise of PCD-CT but have generally not aggregated core metrics and often predate workflow and economic data emerging in late 2024–2025. Flohr et al. presented a seminal cardiac-focused overview in 2023, illustrating early findings such as an approximate 50% calcium-scoring dose reduction and an approximate 11% decrease in blooming-related stenosis overestimation while calling for multicenter outcome and economic evaluations.
Sharma et al. offered a clinician-oriented digest combining phantom, animal, and human data, reporting ranges of 29%–41% in noise reduction, 20%–36% in CNR improvements, and 100%/87% in sensitivity/specificity for in-stent restenosis but without formal synthesis and with limited attention to non-coronary applications.
Hagen et al. broadened the scope to oncology, cardiovascular, and pediatric imaging with a qualitative three-pillar framework. Hagar et al. introduced a more structured approach but included only around 20 cardiac studies up to August 2024. In the vascular domain, Wildberger and Alkadhi reviewed feasibility-level studies and emphasized prototype-related bias and the need for prospective surveillance in endovascular aortic repair follow-up. Van der Bie et al. provided a focused systematic review on stent imaging.
A separate review by Van der Bie et al. addressed clinical aspects of PCD-CT utilization not only in cardiovascular imaging but also in abdominal, thoracic, musculoskeletal, neuro, and pediatric imaging. They specifically investigated stent imaging, coronary stenosis measurements, coronary calcium quantification, plaque component quantification, ECV quantification, TAVI planning, and calcium scoring in the cardiovascular imaging section, following a largely narrative methodology with limited comparative analysis.
Clinical impact and emerging signals
In coronary imaging, UHR and low-keV reconstructions sharpen lumen–plaque interfaces, mitigate blooming in calcified and stented segments, and enable contrast-sparing protocols while maintaining diagnostic performance. Real-world cohorts suggest improved specificity, fewer unnecessary invasive angiographies, and operational efficiencies when functional adjuncts can be derived from the same dataset. In myocardial tissue characterization, delayed iodine maps and ECV estimates demonstrate high concordance with MRI at segment and patient levels, supporting single-session coronary-plus-tissue assessment when MRI is contraindicated or impractical.
For structural-heart/TAVR planning, PCD-CT supports accurate annular measurements and peripheral-access assessment at reduced exposure; VMI reconstructions can facilitate calcium quantification without additional native scans. Within the pulmonary circulation, multi-energy datasets enable iodine-based perfusion mapping alongside embolus detection, often with lower radiation and reduced contrast loads. In aortic and peripheral vascular applications, low-keV VMIs improve vascular conspicuity—particularly in small-caliber infrapopliteal vessels—while supporting dose- and contrast-efficient protocols; early research also indicates potential quantitative biomarkers.
Challenges and evidence gaps
The evidence base remains dominated by single-center experiences with heterogeneous acquisition/reconstruction (tube potentials, matrix/slice thickness, kernels/iterative strengths, and VMI energies) and variable reference standards (ICA, CMR, and DSA). Quantitative thresholds—for example, plaque-component cut-points and calcium-score categories in VNC/VNI workflows—require harmonization. Health economic and workflow data are encouraging but largely model based; prospective utilization and cost-impact studies across health systems are needed. Finally, multicenter trials linking PCD-CT-guided decisions to hard clinical endpoints remain limited.
Future directions
Priorities include the following: (i) multicenter prospective studies with standardized acquisition and reporting checklists; (ii) consensus on recommended VMI energies and quantitative thresholds by indication; (iii) reproducibility studies for ECV/perfusion metrics and for VNC calcium scoring across vendors and sites; (iv) prospective evaluations of AI-enabled adjuncts (e.g., CT-FFR, radiomics) anchored to outcomes; and (v) robust cost-utility and budget-impact analyses in diverse clinical contexts.
Limitations of the evidence and of this review
Most included studies are observational, single-center studies, with heterogeneity that precludes formal pooling. Accordingly, we report study-level results and observed ranges rather than pooled effects. External validity across institutions and vendors and longer-term outcomes require further study.
In conclusion, across cardiovascular applications, PCD-CT has been reported to demonstrate higher spatial resolution, improved tissue/contrast characterization, and greater opportunities for radiation and contrast reduction. These technical gains, together with early signals of diagnostic and workflow efficiency, support an expanding clinical role for PCD-CT, contingent upon confirmation in multicenter outcome and economic evaluations.
Footnotes
Acknowledgements
We thank our radiation technicians Ahmet Sarımehmet and Celal Uzungünay for their help.
Conflict of interest disclosure
Deniz Alis is the CEO and co-founder of Hevi AI Health Tech. However, none of Hevi AI’s solutions are mentioned in this paper. Other authors have nothing to disclose.
References
Si-Mohamed SA, Boccalini S, Lacombe H, et al. Coronary CT angiography with photon-counting CT: first-in-human results. Radiology. 2022;303(2):303-313.
Mergen V, Eberhard M, Manka R, Euler A, Alkadhi H. First in-human quantitative plaque characterization with ultra-high resolution coronary photon-counting CT angiography. Front Cardiovasc Med. 2022;9:981012.
Pourmorteza A, Symons R, Henning A, Ulzheimer S, Bluemke DA. Dose efficiency of quarter-millimeter photon-counting computed tomography: first-in-human results. Invest Radiol. 2018;53(6):365-372.
Symons R, De Bruecker Y, Roosen J, et al. Quarter-millimeter spectral coronary stent imaging with photon-counting CT: initial experience. J Cardiovasc Comput Tomogr. 2018;12(6):509-515.
Symons R, Cork TE, Lakshmanan MN, et al. Dual-contrast agent photon-counting computed tomography of the heart: initial experience. Int J Cardiovasc Imaging. 2017;33(8):1253-1261.
Si-Mohamed SA, Sigovan M, Hsu JC, et al. In vivo molecular K-edge imaging of atherosclerotic plaque using photon-counting CT. Radiology. 2021;300(1):98-107.
Euler A, Higashigaito K, Mergen V, et al. High-pitch photon-counting detector computed tomography angiography of the aorta: intraindividual comparison to energy-integrating detector computed tomography at equal radiation dose. Invest Radiol. 2022;57(2):115-121.
Higashigaito K, Mergen V, Eberhard M, et al. CT Angiography of the aorta using photon-counting detector CT with reduced contrast media volume. Radiol Cardiothorac Imaging. 2023;5(1):e220140.
Yalynska T, Polacin M, Frauenfelder T, Martini K. Impact of photon counting detector CT derived virtual monoenergetic images on the diagnosis of pulmonary embolism. Diagnostics (Basel). 2022;12(11):2715.
Dangelmaier J, Bar-Ness D, Daerr H, et al. Experimental feasibility of spectral photon-counting computed tomography with two contrast agents for the detection of endoleaks following endovascular aortic repair. Eur Radiol. 2018;28(8):3318-3325.
Kotronias RA, de Maria GL, Xie C, et al. Benchmarking Photon-counting computed tomography angiography against invasive assessment of coronary stenosis: implications for severely calcified coronaries. JACC Cardiovasc Imaging. 2025;18(5):572-585.
Fahrni G, Boccalini S, Lacombe H, et al. Ultra-high-resolution 40 keV virtual monoenergetic imaging using spectral photon-counting CT in high-risk patients for coronary stenoses. Eur Radiol. 2025;35(6):3042-3053.
Sakai K, Shin D, Singh M, et al. Diagnostic performance and clinical impact of photon-counting detector computed tomography in coronary artery disease. J Am Coll Cardiol. 2025;85(4):339-348.
Hagar MT, Soschynski M, Saffar R, et al. Accuracy of ultrahigh-resolution photon-counting CT for detecting coronary artery disease in a high-risk population. Radiology. 2023;307(5):e223305.
Araki S, Nakamura S, Takafuji M, Ichikawa Y, Sakuma H, Kitagawa K. Ultra-low-dose coronary computed tomography angiography using photon-counting detector computed tomography. Eur Heart J Imaging Methods Pract. 2024;2(3):qyae125.
Zhao YE, Hu Q, Zhu J, et al. Evaluation of low-dose chest scans for coronary artery calcium scoring using photon-counting computed tomography with different slice thicknesses and iterative reconstruction levels. Quant Imaging Med Surg. 2025;15(4):3565-3574.
Rajiah PS, Dunning CAS, Rajendran K, et al. High-pitch multienergy coronary CT angiography in dual-source photon-counting detector CT scanner at low iodinated contrast dose. Invest Radiol. 2023;58(9):681-690.
Cundari G, Deilmann P, Mergen V, et al. Saving contrast media in coronary CT angiography with photon-counting detector CT. Acad Radiol. 2024;31(1):212-220.
Greffier J, Si-Mohamed SA, Lacombe H, et al. Virtual monochromatic images for coronary artery imaging with a spectral photon-counting CT in comparison to dual-layer CT systems: a phantom and a preliminary human study. Eur Radiol. 2023;33(8):5476-5488.
Vattay B, Boussoussou M, Vecsey-Nagy M, et al. Qualitative and quantitative image quality of coronary CT angiography using photon-counting computed tomography: standard and ultra-high resolution protocols. Eur J Radiol. 2024;175:111426.
Vattay B, Szilveszter B, Boussoussou M, et al. Impact of virtual monoenergetic levels on coronary plaque volume components using photon-counting computed tomography. Eur Radiol. 2023;33(12):8528-8539.
Haag NP, Michael AE, Lennartz S, et al. Coronary Artery calcium scoring using virtual versus true non-contrast images from photon-counting coronary CT Angiography. Radiology. 2024;310(3):e230545.
Vecsey-Nagy M, Varga-Szemes A, Emrich T, et al. Calcium scoring on coronary computed angiography tomography with photon-counting detector technology: predictors of performance. J Cardiovasc Comput Tomogr. 2023;17(5):328-335.
Sharma SP, van der Bie J, van Straten M, et al. Coronary calcium scoring on virtual non-contrast and virtual non-iodine reconstructions compared to true non-contrast images using photon-counting computed tomography. Eur Radiol. 2024;34(6):3699-3707.
Kaldas M, Weber J, Parikh R, et al. Coronary calcium scoring using true and virtual non-contrast reconstructions on photon-counting CT with differing slice increment: impact on calcium severity classifications. J Clin Med. 2025;14(9):2875.
Ayx I, Lichti L, Buettner S, et al. Feasibility of on-site CT-FFR analysis on cardiac photon-counting CT in evaluation of hemodynamically significant stenosis in comparison to invasive catheter angiography. Eur J Radiol. 2025;183:111927.
Brendel JM, Walterspiel J, Hagen F, et al. Coronary artery disease detection using deep learning and ultrahigh-resolution photon-counting coronary CT angiography. Diagn Interv Imaging. 2025;106(2):68-75.
Mundt P, Tharmaseelan H, Hertel A, et al. Periaortic adipose radiomics texture features associated with increased coronary calcium score-first results on a photon-counting-CT. BMC Med Imaging. 2023;23(1):97.
Kahmann J, Tharmaseelan H, Riffel P, et al. Pericoronary radiomics texture features associated with hypercholesterolemia on a photon-counting-CT. Front Cardiovasc Med. 2023;10:1223035.
Kahmann J, Nörenberg D, Papavassiliu T, Schoenberg SO, Froelich MF, Ayx I. Interrelation of pericoronary adipose tissue texture and coronary artery disease of the left coronary artery in cardiac photon-counting computed tomography. Front Cardiovasc Med. 2024;11:1499219.
Vecsey-Nagy M, Emrich T, Tremamunno G, et al. Cost-effectiveness of ultrahigh-resolution photon-counting detector coronary CT angiography for the evaluation of stable chest pain. J Cardiovasc Comput Tomogr. 2025;19(1):106-112.
Tremamunno G, Varga-Szemes A, Kravchenko D, et al. Accuracy of photon-counting detector CT-based iodine maps for myocardial late enhancement detection. Eur Radiol. 2025.
Klambauer K, Klotz E, Moser LJ, et al. Myocardial late enhancement with photon-counting detector CT in spontaneous coronary artery dissection: prospective comparison with cardiac MRI. Invest Radiol. 2026;61(1):32-40.
Popp S, Beitzke D, Strassl A, et al. Evaluation of extracellular volume and coronary artery disease in cardiac amyloidosis using photon-counting CT. Invest Radiol. 2025;60(10):698-707.
Gkizas C, Longere B, Sliwicka O, et al. Photon-counting CT-derived extracellular volume in acute myocarditis: comparison with cardiac MRI. Diagn Interv Imaging. 2025;106(7-8):255-263.
Dirrichs T, Schröder J, Frick M, et al. Photon-counting versus dual-source CT for transcatheter aortic valve implantation planning. Acad Radiol. 2024;31(12):4780-4789.
Yang Y, Richter R, Halfmann MC, et al. Prospective ECG-gated High-pitch photon-counting CT angiography: evaluation of measurement accuracy for aortic annulus sizing in TAVR planning. Eur J Radiol. 2024;178:111604.
Hagar MT, Kluemper T, Hein M, et al. Photon-counting CT-angiography in pre-TAVR aortic annulus assessment: effects of retrospective vs. prospective ECG-synchronization on prosthesis valve selection. Int J Cardiovasc Imaging. 2024;40(4):811-820.
Feldle P, Scheuber M, Grunz JP, et al. Virtual non-iodine photon-counting CT-angiography for aortic valve calcification scoring. Sci Rep. 2024;14(1):4724.
Brendel JM, Walterspiel J, Hagen F, et al. Coronary artery disease evaluation during transcatheter aortic valve replacement work-up using photon-counting CT and artificial intelligence. Diagn Interv Imaging. 2024;105(7-8):273-280.
Sharma SP, Verhemel S, Hirsch A, et al. Diagnostic performance of high and ultra-high-resolution photon counting CT for detection of coronary artery disease in patients evaluated for transcatheter aortic valve implantation. Int J Cardiovasc Imaging. 2024.
Scharm SC, Schaefer-Prokop C, Winther HB, et al. Regional pulmonary morphology and function: photon-counting CT assessment. Radiology. 2023;308(1):e230318.
Kerber B, Hüllner M, Maurer A, et al. Photon-counting detector CT iodine maps versus SPECT/CT: advancing lung perfusion imaging in chronic thromboembolic pulmonary hypertension. Invest Radiol. 2025;60(9):569-576.
Saeed S, Niehoff JH, Boriesosdick J, et al. Minimizing contrast media dose in CT pulmonary angiography with clinical photon counting using high pitch technique. Acad Radiol. 2024;31(2):686-692.
Yalon M, Hoodeshenas S, Chan A, et al. Improved pulmonary artery evaluation using high-pitch photon-counting CT compared to high-pitch conventional or routine-pitch conventional dual-energy CT. J Comput Assist Tomogr. 2024;48(6):897-905.
Dillinger D, Overhoff D, Booz C, et al. Impact of CT photon-counting virtual monoenergetic imaging on visualization of abdominal arterial vessels. Diagnostics (Basel). 2023;13(5):938.
Hennes JL, Huflage H, Grunz JP, et al. An intra-individual comparison of low-keV photon-counting CT versus energy-integrating-detector CT angiography of the aorta. Diagnostics (Basel). 2023;13(24):3645.
Rippel K, Luitjens J, Habeeballah O, et al. Evaluation of ECG-gated, high-pitch thoracoabdominal angiographies with dual-source photon-counting detector computed tomography. J Endovasc Ther. 2024:15266028241230943.
Rippel K, Decker JA, Wudy R, et al. Evaluation of run-off computed tomography angiography on a first-generation photon-counting detector CT scanner - Comparison with low-kVp energy-integrating CT. Eur J Radiol. 2023;158:110645.
Graafen D, Bart W, Halfmann MC, et al. In vitro and in vivo optimized reconstruction for low-keV virtual monoenergetic photon-counting detector CT angiography of lower legs. Eur Radiol Exp. 2024;8(1):89.
Dane B, Mabud T, Melamud K, et al. Reduced intravenous contrast dose portal venous phase photon-counting computed tomography compared with conventional energy-integrating detector portal venous phase computed tomography. J Comput Assist Tomogr. 2024;48(5):675-682.
Dane B, Ruff A, O’Donnell T, et al. Photon-counting computed tomography versus energy-integrating dual-energy computed tomography: virtual noncontrast image quality comparison. J Comput Assist Tomogr. 2024;48(2):251-256.
Yalon M, Inoue A, Thorne JE, et al. Infrapopliteal segments on lower extremity CTA: prospective intraindividual comparison of energy-integrating detector CT and photon-counting detector CT. AJR Am J Roentgenol. 2024;222(3):e2329778.
Ayx I, Schwenke K, Rotkopf L, et al. Feasibility of ultra-high-resolution abdominal CT angiography in PCCT in outperforming conventional EICT. Eur J Radiol. 2025;186:112050.
Ghibes P, Hagen F, Weissinger M, et al. Diagnostic performance of photon-counting CT angiography in peripheral artery disease compared to DSA as gold standard. Eur J Radiol. 2025;182:111834.
Ota T, Nakamoto A, Hori M, et al. Quantification of abdominal aortic calcification using photon-counting CT angiography: an imaging biomarker for high-risk cardiovascular patients. Radiol Med. 2025;130(6):817-829.
Sala A, de Vincentiis C, Grimaldi F, et al. Can the novel photon-counting CT scan accurately predict aortic wall thickness? Preliminary results. Bioengineering (Basel). 2025;12(3):306.
Flohr T, Schmidt B, Ulzheimer S, Alkadhi H. Cardiac imaging with photon counting CT. Br J Radiol. 2023;96(1152):20230407.
Sharma SP, Lemmens MDK, Smulders MW, Budde RPJ, Hirsch A, Mihl C. Photon-counting detector computed tomography in cardiac imaging. Neth Heart J. 2024;32(11):405-416.
Hagen F, Soschynski M, Weis M, et al. Photon-counting computed tomography - clinical application in oncological, cardiovascular, and pediatric radiology. Rofo. 2024;196(1):25-35.
Hagar MT, Schlett CL, Oechsner T, et al. Photon-counting detector CT: advances and clinical applications in cardiovascular imaging. Rofo. 2025;197(5):509-517.
Wildberger JE, Alkadhi H. New horizons in vascular imaging with photon-counting detector CT. Invest Radiol. 2023;58(7):499-504.
van der Bie J, Sharma SP, Hirsch A, et al. Coronary stent imaging with photon-counting detector CT. Radiol Cardiothorac Imaging. 2025;7(3):e240338.
van der Bie J, van der Laan T, van Straten M, et al. Photon-counting CT: an updated review of clinical results. Eur J Radiol. 2025;190:112189.
Pinos D, Griffith J 3rd, Emrich T, et al. Intra-individual comparison of image quality of the coronary arteries between photon-counting detector and energy-integrating detector CT systems. Eur J Radiol. 2023;166:111008.
Rotkopf LT, Froelich MF, Riffel P, et al. Influence of heart rate and heart rate variability on the feasibility of ultra-fast, high-pitch coronary photon-counting computed tomography angiography. Int J Cardiovasc Imaging. 2023;39(5):1065-1073.
McCollough CH, Winfree TN, Melka EF, Rajendran K, Carter RE, Leng S. Photon-counting detector computed tomography versus energy-integrating detector computed tomography for coronary artery calcium quantitation. J Comput Assist Tomogr. 2024;48(2):212-216.
Fink N, Emrich T, Schoepf UJ, et al. Improved detection of small and low-density plaques in virtual non-contrast imaging-based calcium scoring at photon-counting detector CT. Radiol Cardiothorac Imaging. 2024;6(4):e230328.
Mundt P, Hertel A, Tharmaseelan H, et al. Analysis of epicardial adipose tissue texture in relation to coronary artery calcification in PCCT: The EAT Signature! Diagnostics (Basel). 2024;14(3):277.
van der Bie J, Bos D, Dijkshoorn ML, Booij R, Budde RPJ, van Straten M. Thin slice photon-counting CT coronary angiography compared to conventional CT: objective image quality and clinical radiation dose assessment. Med Phys. 2024;51(4):2924-2932.
Wang M, Zhang X, Li J, et al. Quantification accuracy in photon-counting detector CT for coronary artery calcium score: a pilot study. Int J Cardiovasc Imaging. 2024;40(10):2181-2191.
Fahrni G, Boccalini S, Mahmoudi A, et al. Quantification of coronary artery stenosis in very-high-risk patients using ultra-high resolution spectral photon-counting CT. Invest Radiol. 2025;60(2):114-122.
Sartoretti T, Mergen V, Dzaferi A, et al. Effect of temporal resolution on calcium scoring: insights from photon-counting detector CT. Int J Cardiovasc Imaging. 2025;41(3):615-625.