
Abstract
Multinuclear magnetic resonance imaging (MRI), which uses nuclei other than protons (1H), has undergone a dramatic transformation with the advent of regulatory-approved radiofrequency coils. Phosphorus-31 magnetic resonance spectroscopy (³¹P-MRS) and sodium-23 MRI (²³Na-MRI) are now accessible at clinical sites equipped with commercially available surface coils, enabling advanced metabolic and tissue characterization without specialized research infrastructure or ultra-high-field systems. ³¹P-MRS provides a quantitative assessment of cellular energy metabolism and mitochondrial function while enabling the calculation of the intracellular pH. ²³Na-MRI visualizes the in vivo distribution of sodium, which is relevant since sodium ion distribution plays a critical role in cellular function and ionic homeostasis. Sodium concentration serves as an important biomarker of tissue health status. Both ³¹P-MRS and ²³Na-MRI have been widely utilized to assess multiple organ systems as well as diseases of the brain, heart, skeletal muscle, and tumors. However, clinical implementation using newly approved coils remains largely undefined, as the optimal acquisition protocols, target organ selection, coil positioning, interpretation criteria, and disease-specific imaging strategies have not been established. This review synthesized technical considerations for surface coil-based upper abdominal imaging, methodological approaches, and preliminary clinical findings from our initial clinical experience with ³¹P-MRS and ²³Na-MRI.
Keywords: Phosphorus-31, sodium-23, surface coil, hepatic metabolism, intracellular pH, multinuclear imaging
Main points
• Multinuclear magnetic resonance imaging (MRI) is now clinically accessible. With the recent approval of dedicated surface coils, phosphorus-31 magnetic resonance spectroscopy (³¹P-MRS) and sodium-23 MRI (²³Na-MRI) can now be performed on standard 3 Tesla MRI systems without requiring ultra-high-field scanners or specialized research hardware.
• ³¹P-MRS provides direct insight into liver metabolism and intracellular pH (pHi). Phosphorus spectroscopy enables non-invasive evaluation of adenosine triphosphate (ATP) production, membrane turnover, mitochondrial function, and pHi, offering metabolic information beyond conventional proton MRI.
• ³¹P-MRS detects metabolic alterations in chronic liver disease and liver tumors. Changes in metabolite ratios—such as phosphomonoesters to phosphodiesters and inorganic phosphate to ATP—reflect fibrosis severity, inflammation, mitochondrial dysfunction, and tumor proliferation and may allow early assessment of therapeutic response.
• ²³Na-MRI visualizes tissue sodium concentration as a marker of cellular integrity. Because sodium homeostasis depends on energy metabolism and membrane function, increased sodium signal reflects edema, fibrosis, inflammation, and malignant transformation.
• Clinical abdominal applications remain exploratory but promising. Although strong biological rationale and prior research support these techniques, standardized acquisition protocols, interpretation criteria, and clinical validation using commercially approved surface coils are still under development.
Magnetic resonance imaging (MRI) has traditionally relied on the abundant proton (1H) signal to generate structural and functional images of tissue anatomy. Non-proton nuclei have inherently low signal levels, yielding noisy images with prolonged signal acquisition times. Consequently, multinuclear imaging has been attempted primarily with custom-built coils and/or ultra-high-field (UHF) equipment [≥ 7 Tesla (T)], but clinical applications are hindered by challenges and confined to specialized research facilities.,, However, the advent of regulatory-approved multinuclear radiofrequency coils has opened new avenues for the direct assessment of cellular metabolism and tissue composition beyond conventional morphologic imaging. Among the various non-proton nuclei available for clinical imaging, phosphorus-31 (³¹P) and sodium-23 (²³Na) represent the most promising candidates for near-term clinical translation at standard field strengths with commercially available surface coil technology. ³¹P magnetic resonance spectroscopy (³¹P-MRS) and ²³Na-MRI have demonstrated potential applications across multiple organ systems, including the brain, heart, liver, skeletal muscle, and tumors.,,,,,,,,,,,,,,,,,,,,,,,, Both ³¹P-MRS and ²³Na-MRI are available in head-based and surface coil configurations. The recent regulatory approval and commercial availability of surface coil technology have been transformative for clinical implementation, enabling performance of these advanced techniques at any institution equipped with standard MRI systems, without the need for specialized research infrastructure or UHF platforms. We are now entering an exploratory phase to define their optimal clinical applications and capabilities.
Optimal acquisition protocols, target organ selection, coil positioning, disease-specific imaging strategies, interpretation criteria for pathological changes, and standardized quantification methodologies are actively being developed. As this emerging technology matures, establishing consensus regarding these technical parameters, reference values, and clinical decision thresholds will enable broader adoption of these promising diagnostic tools in routine clinical practice.
This review presents our initial clinical experience with ³¹P-MRS and ²³Na-MRI using surface coil technology for upper abdominal organ assessment. We describe technical considerations, acquisition and quantification methods, and preliminary clinical findings, along with a discussion of the pathophysiological basis for metabolic and sodium changes in disease, drawn from the existing literature. We also outline protocol optimization strategies and highlight the potential of multinuclear surface coil imaging for the accurate assessment of organ function and disease characterization. This manuscript is structured as a narrative review. Literature is selected based on clinical and methodological relevance to the topics covered, with particular emphasis on studies informing pathophysiological rationale and acquisition methodology at standard field strengths with commercially available coils. Written informed consent was obtained prospectively from all patients and volunteers whose images and clinical information are presented in this article.
Surface coil technology: design characteristics and system integration
The commercially available surface P-140-Flex and Na-140-Flex coils (Philips Healthcare, Best, the Netherlands) utilized for ³¹P-MRS and ²³Na-MRI, respectively, were investigated in this review. Notably, both coils share identical external morphology and physical dimensions, despite their distinct nuclear tuning characteristics (). Each coil features a 14-cm² surface coil design, optimized for close tissue contact and superior signal reception from superficial to mid-depth anatomical structures.
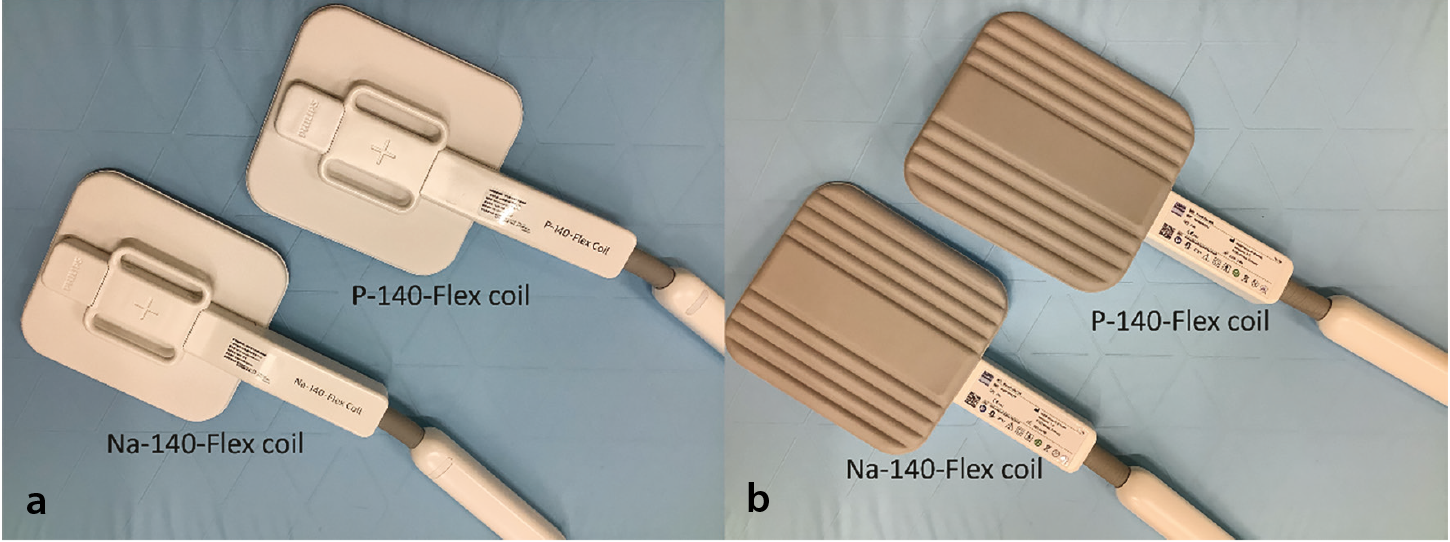
Both the P-140-Flex and Na-140-Flex coils are designed for integration with existing MRI systems equipped with multinuclear capability. Each coil operates in transmit–receive (T/R) mode with a single-channel architecture, providing dedicated radiofrequency transmission and reception specific to the nucleus being imaged. This single-channel design minimizes interference and optimizes the signal-to-noise ratio (SNR) for the target nucleus while maintaining versatility across clinical applications. The coils support multi-purpose applications across various anatomical regions via the standard T/R interface coil connection.
The T/R interface connection ensures seamless integration with the MRI system’s radiofrequency pathway and automated tuning capabilities, streamlining clinical workflow and enabling efficient transition between ³¹P and ²³Na acquisitions without requiring system recalibration.
Clinical workflow and coil exchange procedure
A major advantage of the P-140-Flex and Na-140-Flex surface coils is their compatibility with existing clinical MRI systems, without the need for hardware modifications or specialized equipment upgrades.
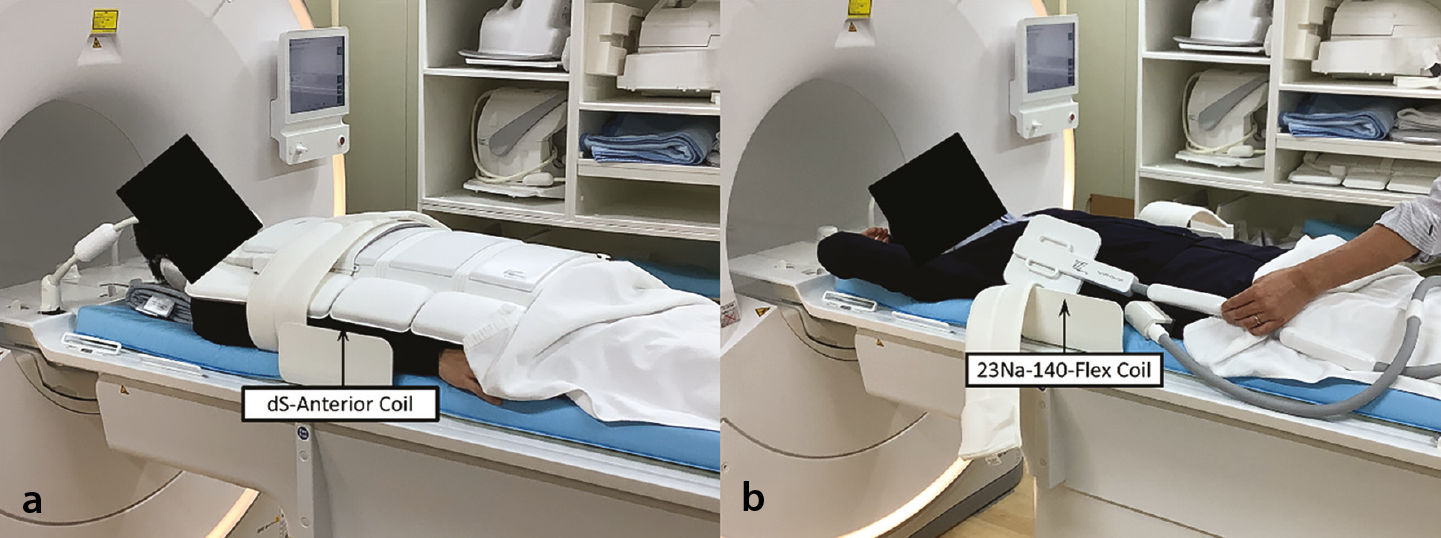
Although the surface coils are compatible with existing MRI hardware, the clinical workflow requires a coil exchange procedure during patient imaging. After completing conventional proton imaging acquisitions with the standard body coil, the patient must be repositioned outside the MRI gantry to allow replacement of the anterior body coil with the dedicated ³¹P-MRS or ²³Na-MRI surface coil. The patient is then reintroduced into the scanner for multinuclear acquisitions ().
Spatial sensitivity characteristics and detection range
The P-140-Flex and Na-140-Flex surface coils demonstrate characteristic sensitivity patterns that are fundamental to understanding their capabilities and limitations in clinical practice (). The sensitivity of surface coil radiofrequency reception is not uniform throughout the detection volume but rather exhibits a spatially dependent profile determined by the coil’s electromagnetic field configuration. This non-uniform sensitivity distribution is inherent to the surface coil design.
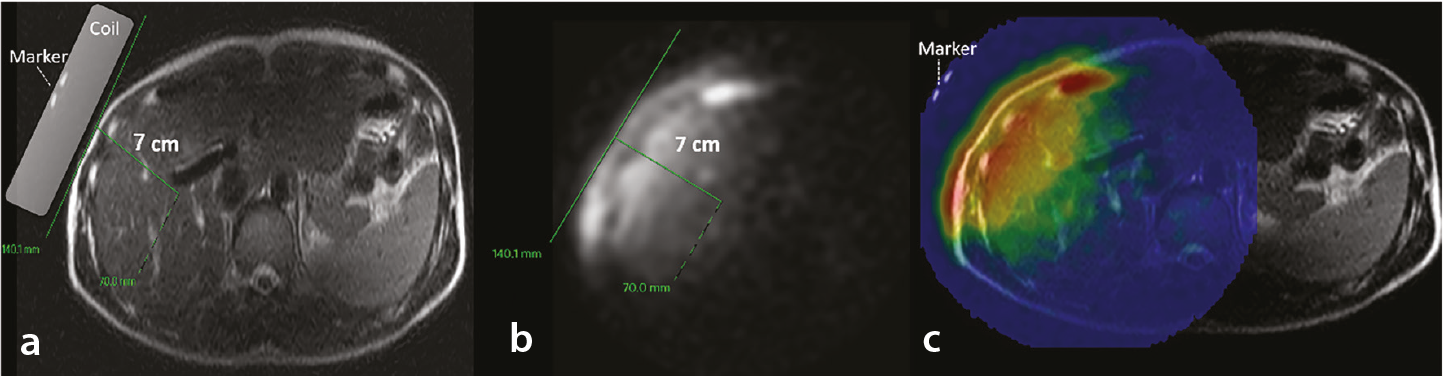
The effective detection depth provided by these 14-cm surface coils extends to approximately 7 cm from the coil surface. Tissues located deeper than 7 cm from the coil surface receive progressively diminished signal reception, which may hinder adequate assessment with good diagnostic quality. Within this accessible depth range, sensitivity is highest in tissue regions immediately underlying the coil center. As the distance increases from the coil center—either radially across the 14-cm² field of view or longitudinally into deeper tissues—the signal intensity declines progressively. This center-high, periphery-low sensitivity pattern necessitates careful anatomical positioning to ensure that the target organ or region of clinical interest is located within the optimal sensitivity zone for maximum diagnostic quality.
Although ³¹P-MRS employs spectroscopic acquisitions and ²³Na-MRI produces conventional images, both modalities share fundamentally similar spatial sensitivity profiles, as they depend on the same electromagnetic field geometry of the surface coil.
In addition to these depth and sensitivity constraints, several additional technical limitations merit acknowledgment. Respiratory motion during the necessarily long acquisition times required for ³¹P and ²³Na nuclei results in signal averaging across respiratory phases, potentially degrading spectral resolution and spatial precision. The single-channel architecture of the currently approved coils further limits SNR and precludes parallel imaging acceleration. Together, these factors constrain the range of anatomical targets that are realistically assessable and underscore the need for continued protocol optimization.
Principles and clinical significance of phosphorus-31 magnetic resonance spectroscopy
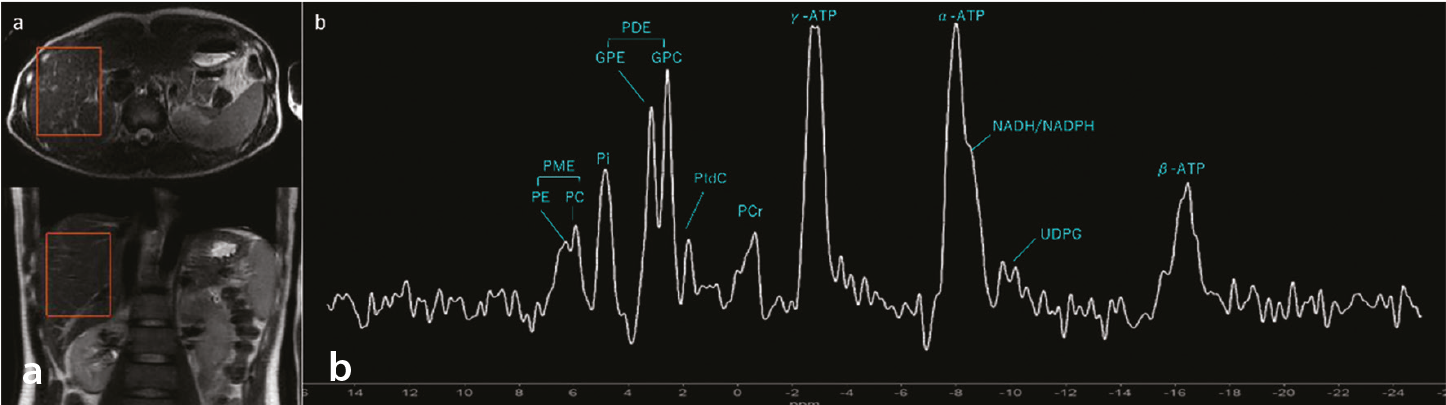
³¹P-MRS is a non-invasive technique that detects phosphorus-containing metabolites critical to cellular bioenergetics and phospholipid metabolism. The ³¹P-MRS spectrum encompasses key compounds universally relevant to tissue metabolism. Inorganic phosphate (Pi), phosphocreatine (PCr), and adenosine triphosphate (ATP) resonances (α-ATP, β-ATP, and γ-ATP) provide direct quantification of cellular energy status and mitochondrial oxidative capacity. The phosphomonoester (PME) region, including phosphoethanolamine (PE) and phosphocholine (PC), reflects phospholipid membrane synthesis, and the phosphodiester (PDE) region, comprising glycerophosphoethanolamine (GPE) and glycerophosphocholine (GPC), represents phospholipid membrane degradation products., The chemical shift position of the Pi peak is pH-dependent, enabling simultaneous non-invasive determination of the intracellular pH (pHi)—a fundamental parameter reflecting the balance between metabolic activity and acid–base homeostasis.
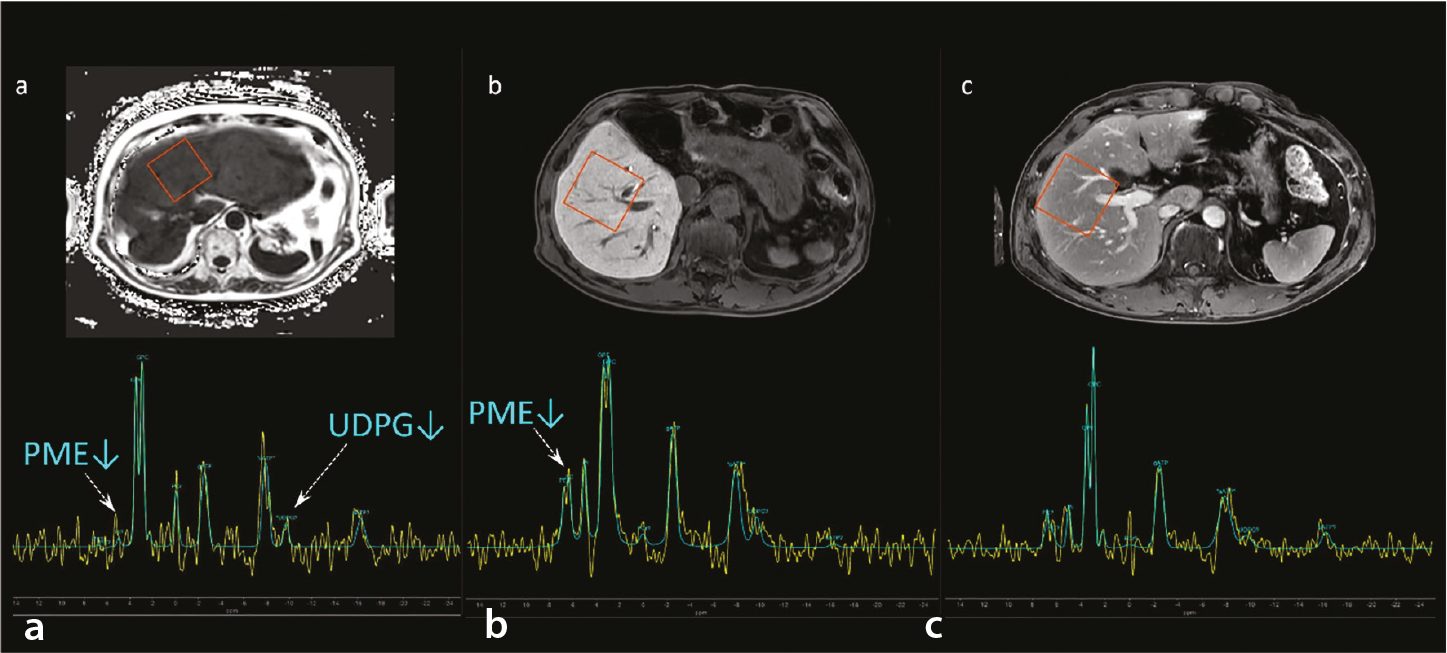
The substantial size and relatively superficial anatomical location of the liver within the upper abdomen position it favorably for surface coil interrogation. Furthermore, since the liver is a metabolically active parenchymal organ, it is fundamental to energy metabolism and oxidative phosphorylation, rendering it an appropriate subject for assessment via phosphorus spectroscopy. In the liver, the ³¹P-MRS spectrum also captures organ-specific metabolic processes. The PME region reflects not only phospholipid membrane synthesis but also gluconeogenic activity, making it particularly informative in the context of hepatic metabolic dysfunction. Furthermore, uridine diphosphate glucose and nicotinamide adenine dinucleotide/nicotinamide adenine dinucleotide phosphate are detectable in hepatic spectra, reflecting glycogen metabolism and oxidative stress, respectively ().,
Clinical application of phosphorus-31 magnetic resonance spectroscopy in hepatic parenchymal assessment
Relative to proton (1H) spectroscopy, ³¹P-MRS requires relatively large voxel sizes and longer measurement durations because of the inherently lower sensitivity of phosphorus metabolites in vivo.
The adoption of surface coil technology necessitates careful optimization of imaging methodology to prevent signal contamination from adjacent anatomical structures—particularly the abdominal wall musculature—ensuring accurate and stable signal acquisition from the hepatic parenchyma. Various localization techniques have been proposed for ³¹P-MRS of the liver, including two-dimensional (2D) and three-dimensional (3D) chemical shift imaging (CSI) for metabolic mapping, slab-selective one-dimensional image-selected in vivo spectroscopy (ISIS) to reduce contamination from extra-hepatic tissues, and single-voxel 3D ISIS, for fast and accurate spatial localization. Each method possesses distinct advantages and disadvantages, requiring careful consideration of clinical protocol design and research objectives.
Acquisition parameters and spectroscopic techniques
Given the relatively short T2 relaxation times of ³¹P metabolites, acquisition strategies should minimize the influence of T2 relaxation decay and J modulation on the acquired signals. Consequently, “pulse-acquire” or “non-echo” free induction decay (FID)-based MRS techniques are generally preferred. Another critical consideration is the relatively large spectral dispersion characteristic of ³¹P-MRS. A chemical shift displacement error can introduce significant bias in the localization accuracy of ³¹P spectral data. Therefore, chemical shift displacement error-reducing methods employing selective, refocusing, and inversion pulses with relatively large radiofrequency bandwidths are routinely implemented., , Among the available techniques, single-voxel spectroscopy (SVS) using ISIS represents the only FID-based approach that achieves full signal localization within a single acquisition. Based on prior studies, high-quality spectra with accurate 3D spatial selectivity can be reliably acquired using the ISIS sequence within clinically acceptable measurement durations. For hepatic parenchymal assessment, SVS localization sequences enabling complete signal localization in one acquisition are particularly advantageous.
Irrespective of the clinical indication—whether diffuse liver disease or hepatic tumor assessment—standardization of the nutritional and metabolic state before ³¹P-MRS acquisition is an important protocol consideration. Studies examining the effect of fasting duration on hepatic ³¹P-MRS have demonstrated no significant changes in the PME/β-ATP, PDE/β-ATP, or Pi/β-ATP ratios following 3–5 hours of fasting compared with overnight fasting, in both healthy liver parenchyma and hepatic metastases. These findings suggest that strict overnight fasting may not be mandatory for routine ³¹P-MRS examination; however, maintaining a consistent fasting protocol across patients and institutions remains advisable to minimize metabolic variability.
Phosphorus-31 magnetic resonance spectroscopy findings in chronic liver disease
³¹P-MRS has been established as a powerful tool for the non-invasive investigation of human hepatic metabolism under various physiological and pathophysiological conditions., ,,,,,,,,,, Numerous ³¹P-MRS studies have investigated the metabolic alterations associated with various diffuse hepatic disorders., ,,,,,,,,, Previous studies have demonstrated the utility of hepatic phosphorus metabolite quantification in diagnosing metabolic dysfunction-associated steatotic liver disease (MASLD)/metabolic dysfunction-associated steatohepatitis (MASH),,, alcoholic liver disease,, viral hepatitis, cirrhosis,,, and hepatic manifestations of diabetes. Metabolite ratios rather than absolute quantification are employed clinically, as they inherently correct for coil loading variations, magnetic field inhomogeneities, and other instrumentation-related variables, enabling robust and reproducible measurements across institutions ().,,,,,,,,,
Phosphorus-31 magnetic resonance spectroscopy in MASLD and MASH
Saturation transfer ³¹P-MRS reveals impaired mitochondrial function in MASH, with a significantly reduced phosphate-to-ATP exchange rate constant (k) and forward ATP flux compared with simple steatosis. These findings reflect the energy deficit and impaired oxidative capacity, which correlate with inflammation severity. The γ-ATP/total phosphorus ratio progressively declines with advancing fibrosis, indicating cumulative mitochondrial damage across disease stages.,,
PME resonances reflect gluconeogenesis pathway activity. PME/Pi ratios are significantly elevated in patients with MASLD and obesity compared with non-obese patients with MASLD and controls, indicating increased hepatic glucose production. Notably, even non-obese patients with MASLD demonstrate elevated gluconeogenesis markers, indicating metabolic dysfunction across the obesity spectrum. PME ratios correlate with body mass index, waist circumference, and insulin resistance markers, suggesting an association between hepatic gluconeogenic activity and systemic metabolic abnormalities.,,
Phosphorus-31 magnetic resonance spectroscopy in alcoholic liver disease
The PE/PC ratio can reportedly distinguish between cirrhotic and non-cirrhotic disease in alcoholic liver disease, according to a few studies,, potentially reflecting impaired phosphatidylethanolamine N-methyltransferase (PEMT) activity. Acetaldehyde-mediated PEMT inhibition may reduce phosphatidylcholine synthesis, thereby compromising membrane integrity and promoting hepatocyte apoptosis and inflammation. Although preliminary findings suggest that this ratio could serve as a non-invasive marker of phospholipid pathway disruption specific to alcohol-related liver injury, independent validation in larger cohorts is warranted before its adoption as a reliable diagnostic parameter ().
Phosphorus-31 magnetic resonance spectroscopy in chronic hepatitis C
PME/PDE ratios enable differentiation of mild-to-moderate chronic hepatitis from cirrhosis in hepatitis C infection, suggesting that PME/PDE elevation represents a marker of cirrhotic transformation. The Pi/ATP ratio correlates inversely with hepatic synthetic function parameters, potentially possessing utility for assessing hepatic functional reserve ().
Cirrhosis (pan-etiology findings)
PME comprises membrane synthesis intermediates (PE and PC), whereas PDE comprises membrane degradation products (GPC and GPE). In cirrhosis of various etiologies, elevated PME/(PME + PDE) ratios reflect disrupted membrane turnover, whereas declining GPC/(PME + PDE) ratios with disease severity indicate reduced membrane synthetic capacity. PCr accumulation, unusual in normal hepatocytes, emerges in advanced liver disease, likely reflecting compensatory upregulation in non-parenchymal cells during microvascular dysfunction and tissue hypoxia. PCr/TP ratios correlate with the fibrosis stage, suggesting metabolic adaptation to chronic energy deficits. Nicotinamide adenine dinucleotide phosphate/(PME + PDE) ratios are significantly elevated in cirrhosis compared with controls, reflecting ongoing oxidative stress and fibrogenic activity, irrespective of the underlying etiology.
Across chronic liver diseases of diverse etiologies, reduced ATP levels reflect declining functional hepatocyte mass and correlate with the clinical hallmarks of hepatic failure, including reduced prealbumin synthesis and paradoxical normalization of serum transaminase levels. The Pi/ATP ratio is inversely correlated with hepatic synthetic function parameters, providing a non-invasive assessment of the hepatic functional reserve.,,
Technical considerations for liver tumor assessment
In previous studies using custom-built coils, volume localization for ³¹P-MRS was achieved using slice selection or suppression, single-voxel localization (i.e., ISIS or modified ISIS), or one-dimensional, 2D, or 3D CSI approaches., Unlike the liver parenchyma, when using a surface coil, 2D-CSI—also known as multi-voxel spectroscopic imaging—is considered the most suitable acquisition strategy for hepatic tumor applications among the available options for several reasons.,
First, surface radiofrequency coils exhibit marked spatial sensitivity variation, with rapid signal attenuation as a function of depth due to B1 inhomogeneity. This is particularly problematic in hepatic ³¹P-MRS for deep-seated tumors. In SVS techniques such as ISIS, accurate voxel placement is technically challenging and operator-dependent; minor misregistration, respiratory motion, and chemical shift displacement effects may result in substantial partial-volume contamination from the surrounding parenchyma., In contrast, 2D-CSI provides simultaneous spatial encoding over a predefined slab, enabling retrospective selection of tumor-containing voxels and reducing reliance on precise prospective localization. This spatial robustness makes 2D-CSI more suitable for metabolic assessment of deep hepatic tumors, albeit at the expense of a lower SNR per voxel compared with optimized SVS.
Second, hepatic tumors are frequently heterogeneous both metabolically and morphologically. SVS yields a single averaged spectrum that may obscure intratumoral variation, whereas 2D-CSI enables spatial mapping of phosphorus metabolites across the tumor tissue, adjacent parenchyma, and normal liver within a single acquisition. This multi-voxel approach permits direct voxel-by-voxel comparison of metabolite ratios between tumor-containing voxels and adjacent normal parenchyma, enabling characterization of intratumoral metabolic heterogeneity while minimizing inter-scan variability. Such simultaneous intra-examination comparison between the tumor and hepatic parenchyma represents a distinct advantage over single-voxel acquisition.
Third, compared with full 3D-CSI, 2D-CSI offers a practical compromise between spatial coverage and acquisition time, as 3D encoding substantially increases scan duration and susceptibility to respiratory motion. Although 3D-CSI at UHF offers superior spatial resolution, commercially approved ³¹P coils are currently limited to systems up to 3T; therefore, 2D-CSI represents the most practical localization strategy for hepatic tumor imaging in clinical settings.
Phosphorus-31 magnetic resonance spectroscopy in liver malignancies
³¹P-MRS has demonstrated consistent and clinically meaningful metabolic alterations in both hepatocellular carcinoma (HCC) and liver metastases compared with healthy liver tissue. Across studies reviewed by Seelen et al., before therapy, PME/Pi and PME/PDE ratios were uniformly elevated in liver tumors by 2%–267% and 21%–233%, respectively, reflecting enhanced membrane turnover associated with cell proliferation. These findings are consistent with in vitro ³¹P-MRS data demonstrating elevated PC and PE—the principal PME constituents—along with reduced GPC and GPE in the tumor tissue relative to normal hepatic parenchyma.
Regarding treatment monitoring, PME/Pi ratios were consistently decreased following therapy across all eligible studies (−13% to −76%), suggesting that ³¹P-MRS may serve as a reliable early marker of the therapeutic response, preceding morphological changes detectable by conventional imaging. However, changes in PME/PDE upon therapy were heterogeneous—decreasing in some studies but increasing in others—likely reflecting differences in tumor etiology, treatment modality, and timing of post-treatment acquisition (, , , ). In patients with hepatic metastases from gastro-esophageal cancer, PC and PE were markedly elevated before chemotherapy, and PME levels remained high or increased after 2 weeks of treatment, correlating with disease progression at 2 months. Spatial metabolite mapping further revealed intratumoral heterogeneity and metabolic alterations extending beyond visible tumor margins.
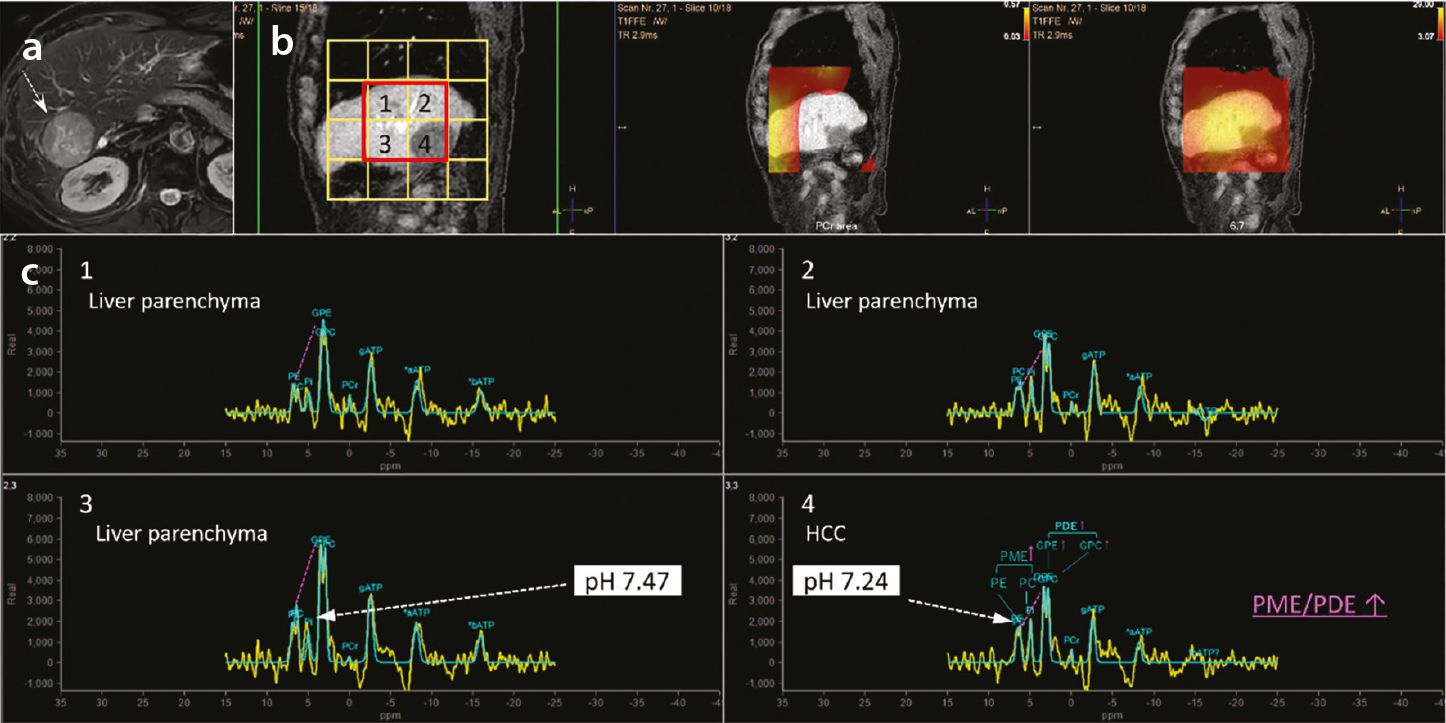
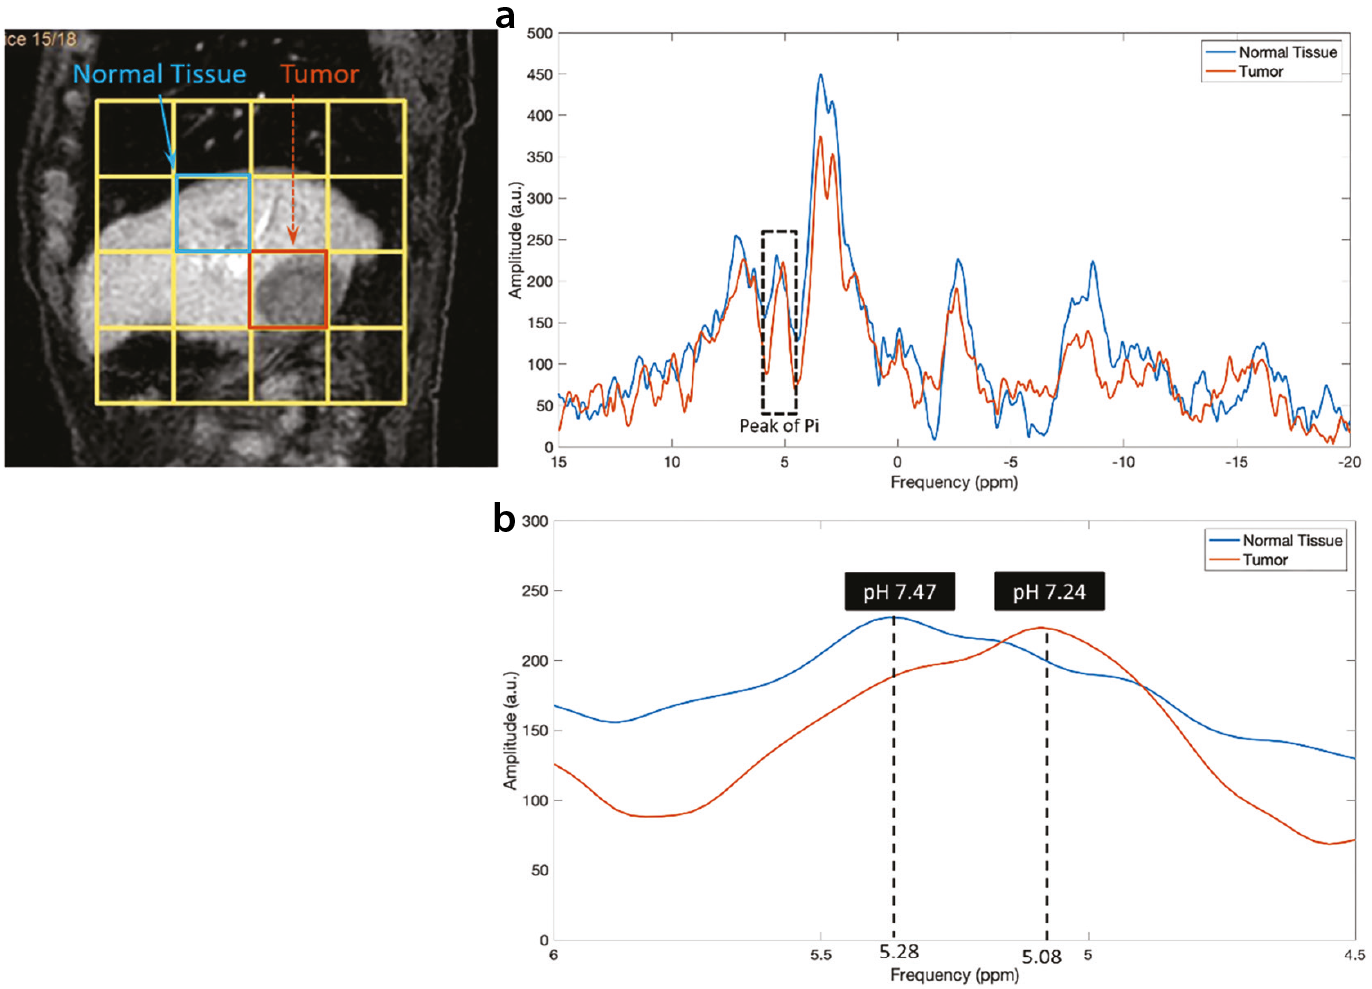
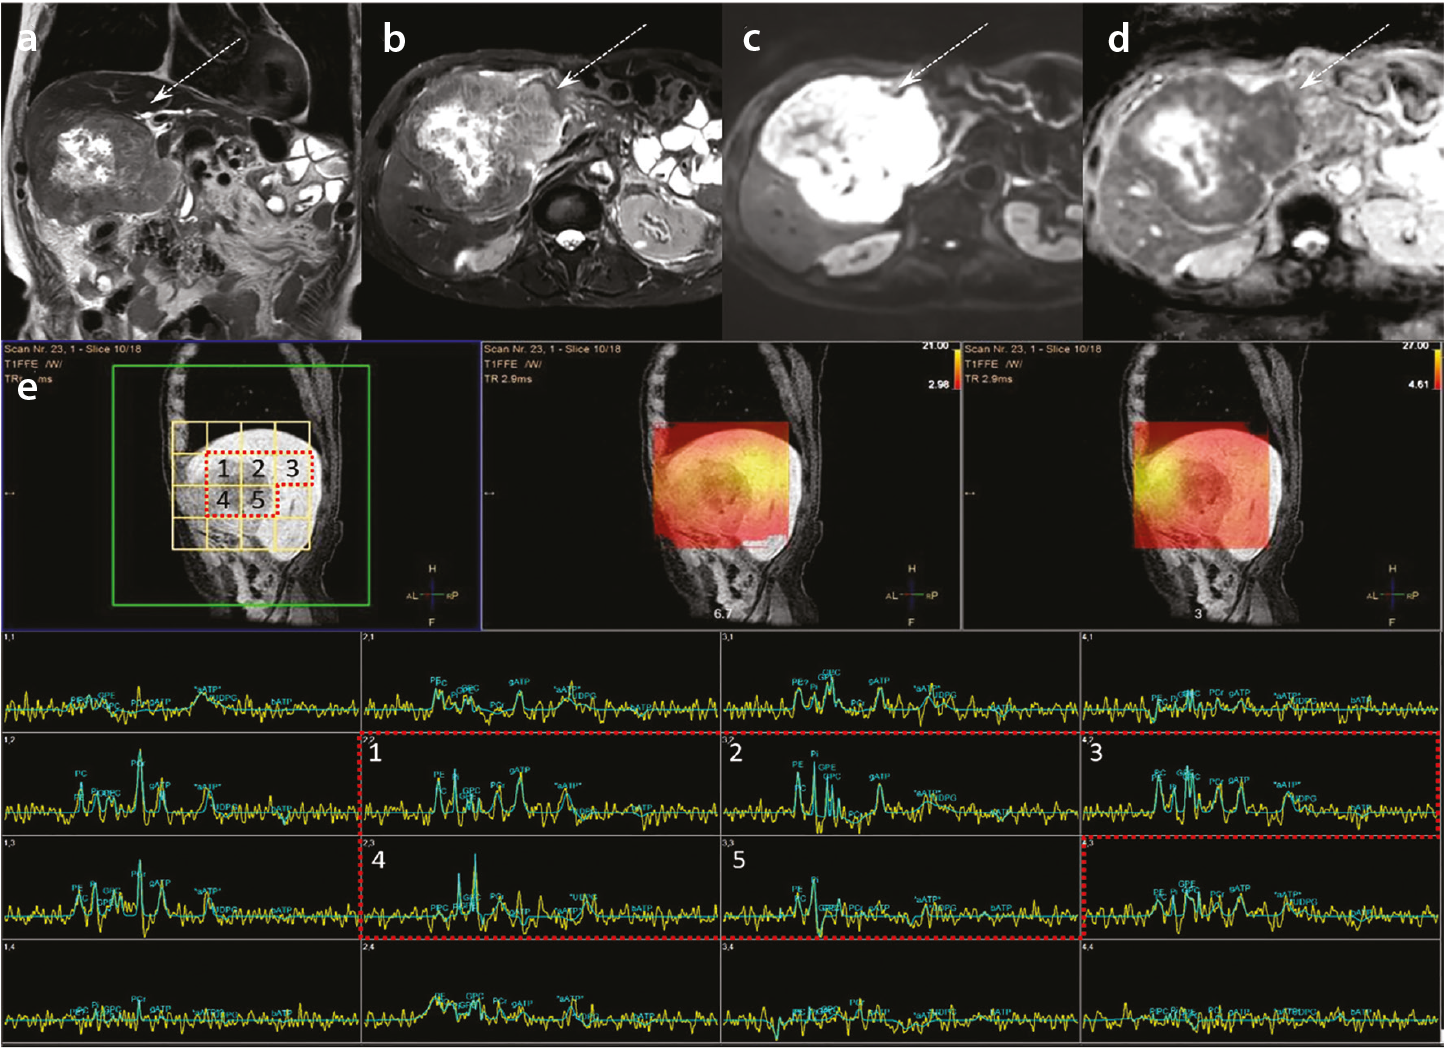
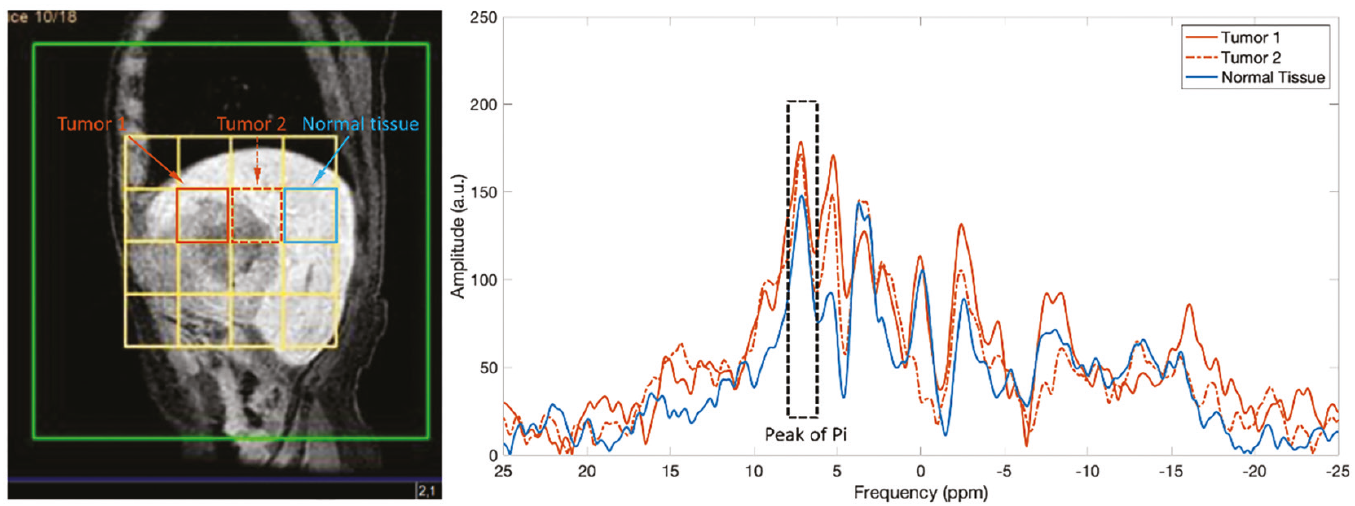
Collectively, these findings indicate that ³¹P-MRS, particularly ³¹P MRSI at UHF, holds substantial promise for the non-invasive assessment of tumor metabolism, early therapeutic response evaluation, and treatment monitoring in hepatic malignancies. However, whether comparable data can be obtained using regulatory-approved surface coils remains to be established, warranting further case accumulation and validation.
Measurement of pH using phosphorus-31 magnetic resonance spectroscopy in hepatic malignancies
³¹P-MRS enables non-invasive measurement of pHi by exploiting the pH-dependent chemical shift of Pi. The Pi resonance shifts according to the ionization equilibrium between H2PO4- and HPO4²- (pKa = 6.75), and reference peaks such as PCr or α-ATP are pH-insensitive.
The calculation formula for pH (standard Henderson–Hasselbalch equation) is as follows

where δ_obs is the observed Pi chemical shift, δ(H2PO4-) = 3.27 ppm, and δ(HPO42-) = 5.68 ppm (relative to PCr at 0 ppm). Under physiological conditions, normal pHi is approximately 7.0–7.2.
Challenges in hepatic phosphorus-31 magnetic resonance spectroscopy
Unlike muscles or the brain, the normal liver contains negligible PCr, requiring α-ATP (approximately −7.5 ppm) as the reference peak. Additionally, the Pi signal is characteristically minute or absent in the healthy liver due to rapid phosphate utilization and high phosphorylation potential, rendering pH calculation unreliable. In hepatic malignancies such as HCC, metastases, and cholangiocarcinoma, the Pi peak often becomes more prominent, reflecting altered energy metabolism and reduced phosphorylation potential. Compared with normal hepatic parenchyma, tumor cells exhibit a relatively lower pHi, consistent with enhanced glycolytic flux and the Warburg effect. Notably, although the pHi of tumor cells is lower than that of normal hepatocytes, it is higher than the characteristically acidic extracellular tumor microenvironment (approximately 6.5–6.9), reflecting active proton extrusion via Na+/H+ exchanger activity (, , , )., However, the accuracy of pHi values derived from ³¹P-MRS requires further validation before definitive clinical interpretation can be established.
Phosphorus-31 magnetic resonance spectroscopy in pancreatobiliary malignancies
In vivo ³¹P-MRS of the human pancreas represents an emerging and largely unexplored application. Recent feasibility studies at 7T field strength have demonstrated the technical capability of ³¹P-MRS with full abdominal coverage and a 20-mm isotropic voxel size for pancreatic assessment. In healthy individuals, pancreatic ³¹P metabolite measurements show acceptable repeatability, with intrasubject coefficients of variation for PME, PDE, and PME/PDE ratios below 20%, indicating reproducible quantification.
Notably, the PME and PME/PDE ratios are significantly higher in pancreatic tissue than in hepatic tissue in healthy individuals, suggesting inherent metabolic differences between organs. In a patient with pancreatic ductal adenocarcinoma, relative PME signals were qualitatively higher than those in healthy pancreatic tissue, suggesting potential utility of PME elevation as a marker of malignant transformation. However, systematic investigation of pancreatic cancer using ³¹P-MRS has not yet been reported in the literature.
Technical limitations constrain the clinical applicability of ³¹P-MRS for certain hepatopancreatobiliary organs. Because commercially available coils are surface coils, deep-seated organs such as the pancreas and small-volume tumors such as gallbladder carcinomas pose considerable detection challenges due to limited penetration depth and SNR; they are, therefore, considered inherently difficult targets for clinical ³¹P-MRS application. It should be noted that all existing pancreatic ³¹P-MRS data derive from feasibility studies conducted at UHF (7T), and evidence obtained using commercially available surface coils at standard clinical field strengths is entirely lacking. Accordingly, the applicability of these preliminary findings to surface coil-based imaging in routine clinical settings remains to be established.
Biological significance of sodium in human physiology
Sodium is a vital component of the human body involved in osmoregulation and pH regulation as well as in cell physiology through the regulation of the transmembrane electrochemical gradient., , Tissue sodium concentration (TSC) is tightly regulated by healthy cells and is altered by energy status and cellular integrity, making it an effective marker for disease states. Cells maintain a low intracellular Na+ concentration by actively pumping Na+ ions out via the Na+/K+ ATPase channel. Under normal physiological conditions, the intracellular sodium concentration is maintained at approximately 10–15 mM, whereas the extracellular concentration is 140–150 mM., Any pathological process that compromises cellular energy metabolism or membrane integrity disrupts this gradient, increasing TSC detectable by ²³Na-MRI.,
Drastic metabolic alterations occur in malignant tumors, often to account for hypoxic intratumor conditions, leading to a decrease in cytosolic pH. To compensate, Na+ ions from the extracellular space are exchanged for protons via the Na+/H+ antiporter. This mechanism creates a characteristic elevation of intracellular sodium in malignant tissue, forming the basis for ²³Na-MRI as a cancer biomarker.,
Scan sequences for sodium-23 magnetic resonance imaging: characteristics, advantages, and limitations
²³Na-MRI can be implemented using several ultrashort echo time (UTE)–based acquisition strategies. Non-Cartesian techniques such as 3D radial UTE, twisted projection imaging, and 3D cone trajectories enable submillisecond echo times and provide relatively high SNR efficiency, making them well suited to the extremely short transverse relaxation time (T2) and effective transverse relaxation time (T2*) of sodium. These approaches are widely used for quantitative TSC mapping but often require specialized reconstruction methods and are primarily available in research settings., Cartesian UTE sequences based on a spoiled gradient-echo (GRE) framework offer simpler and more robust implementation, albeit with lower SNR efficiency. Balanced steady-state free precession UTE, known as balanced fast field echo UTE (bFFE-UTE) in some systems, theoretically provides high SNR efficiency but is sensitive to static magnetic field (B0) inhomogeneity and banding artefacts, with its practical advantage reduced in 23Na-MRI due to the very short T2*. Spoiled GRE-based UTE sequences, such as turbo field echo UTE (TFE-UTE), are more robust to off-resonance effects and, therefore, may be advantageous in regions with B0 inhomogeneity, although their theoretical SNR is lower than that of balanced steady-state approaches.,
In clinical practice, where commercially available sodium coils are used, the applicable sequence options are determined by the MRI vendor’s platform. The two principal candidates are bFFE-UTE and TFE-UTE, each with distinct physical characteristics and practical trade-offs. bFFE-UTE is based on a bSSFP framework, which theoretically offers high SNR efficiency by utilizing both longitudinal and transverse magnetization, along with T1/T2-weighted contrast. However, its practical SNR advantage is diminished in 23Na-MRI because the extremely short T2* of sodium prevents full steady-state formation before signal decay onset. Moreover, bSSFP-based sequences are inherently sensitive to B0 inhomogeneity and prone to banding artefacts, which can substantially degrade image quality in anatomically challenging regions such as the upper abdomen.,,
TFE-UTE is based on a spoiled GRE framework, offering considerably greater robustness against off-resonance effects and immunity to banding artefacts. These properties better equip TFE-UTE for abdominal ²³Na-MRI, where achieving uniform magnetic field conditions is inherently difficult. Its primary limitation is a lower theoretical SNR than bFFE-UTE; however, given that the steady-state transverse magnetization of ²³Na is negligible due to its short T2*, the practical SNR difference between the two sequences may be smaller than theoretical predictions suggest. Ernst angle optimization remains important to maximize signal efficiency.,
In summary, although bFFE-UTE offers higher theoretical SNR under favorable field homogeneity conditions, TFE-UTE provides superior practical stability in the upper abdomen, and the SNR disadvantage of TFE-UTE is partially offset by the intrinsic T2* limitations of ²³Na-MRI.
Phantom-based validation of the sodium coil for sodium-23 magnetic resonance imaging
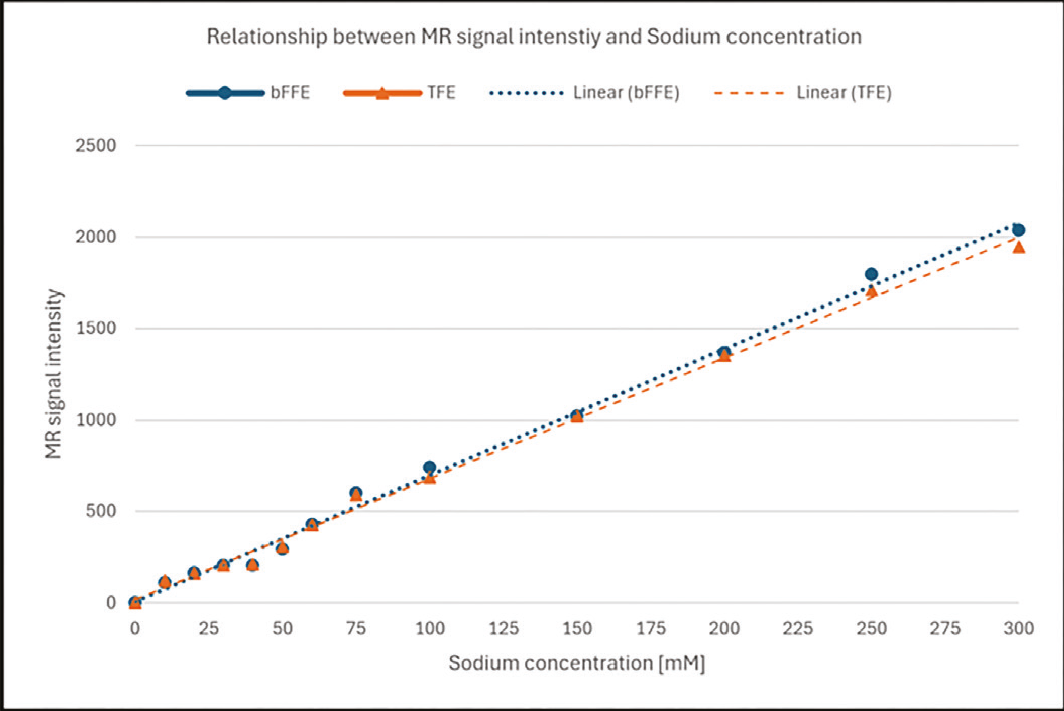
To confirm the capability of the sodium coil to detect and differentiate sodium concentrations, phantom imaging was performed using solutions of varying sodium concentrations ranging from 10 to 300 mM using regulatory-approved Na coils. On both T1- and T2-weighted images acquired with a conventional proton coil, no discernible differences in signal intensity were observed among phantoms of differing sodium concentrations (). In contrast, ²³Na images acquired using the dedicated sodium coil clearly depicted concentration-dependent signal variations, with higher sodium concentrations corresponding to greater signal intensity (, ). Quantitative analysis confirmed a strong linear relationship between sodium concentration and ²³Na MR signal intensity for both bFFE and TFE acquisition sequences (), demonstrating that the sodium coil provides reliable and quantitative detection of sodium concentration differences across a physiologically and clinically relevant range. These findings validate the fundamental capability of the sodium coil for subsequent in vivo ²³Na-MRI applications.

Sodium-23 magnetic resonance imaging in the normal liver
When the upper abdomen is surveyed using this commercially available ²³Na coil, high sodium signal intensity is readily detected in the gallbladder bile, costal cartilage, and renal parenchyma—structures known for their elevated sodium content—whereas the hepatic parenchyma exhibits considerably lower ²³Na signal intensity relative to these structures (). These findings demonstrate that the Na-140-Flex surface coil is capable of capturing physiologically meaningful sodium contrast across clinically relevant upper abdominal organs without requiring custom-built or research-grade hardware.
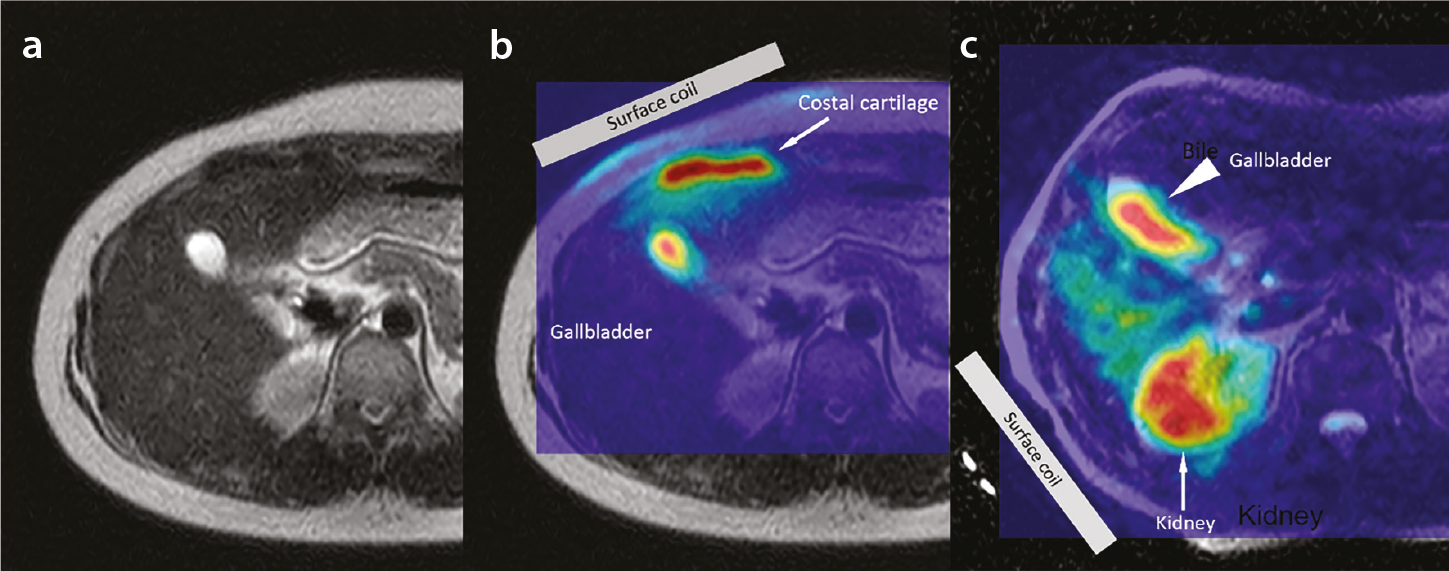
Recent technical advances in ²³Na-MRI have enabled quantification of mean hepatic TSC in healthy volunteers, reported as approximately 20 mM—consistent with the known physiology of normal liver tissue, in which sodium is predominantly localized to the extracellular compartment (approximately 140 mM) and the extracellular fluid fraction comprises 15%–20% of liver volume.
Mechanisms of sodium accumulation in liver fibrosis and chronic liver disease
Experimental evidence supporting the potential of ²³Na-MRI for detecting acute hepatocellular injury was derived from a rat model of carbon tetrachloride (CCl4)-induced hepatotoxicity. Using a dual-tuned ¹H/²³Na birdcage coil, Towner et al. demonstrated that within 1–2 hours of CCl4 administration, a localized increase in the ²³Na signal was observed in the periportal region, spatially corresponding to edematous tissue identified on co-registered ¹H MRI. This finding reflects disrupted transmembrane sodium homeostasis and increased Na+ flux associated with early hepatocellular membrane injury. Notably, pretreatment with alpha-phenyl-tert-butyl nitrone, a free radical spin trap, substantially attenuated both the edematous response on ¹H MRI and sodium signal elevation on ²³Na-MRI, providing direct in vivo evidence that free radical intermediates—arising from CCl4 metabolism—are key mediators of membrane dysfunction and subsequent sodium dysregulation.
Using the regulatory-approved Na-140-Flex surface coil, an elevated ²³Na signal was observed in the resection margin of a patient who had undergone partial hepatectomy, with persistent edema at the surgical margin 2 months postoperatively (). This observation suggests that ²³Na-MRI with a commercially available surface coil may be capable of detecting prolonged sodium accumulation associated with post-procedural inflammatory and edematous changes in hepatic tissue, consistent with the disrupted sodium homeostasis observed in experimental hepatocellular injury models.
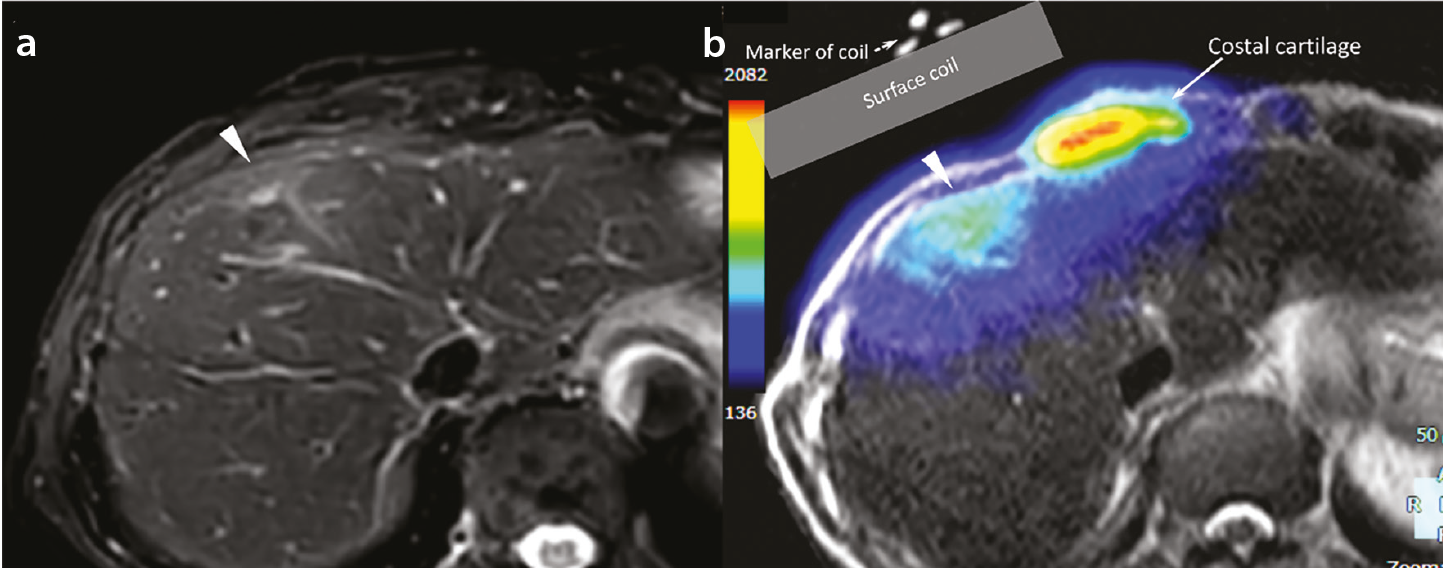
The theoretical rationale for elevated hepatic TSC in chronic liver disease is supported by several complementary pathophysiological mechanisms. First, fibrosis-related expansion of the extracellular matrix increases the extracellular volume fraction; since the extracellular sodium concentration (approximately 140 mM) is approximately 10-fold higher than the intracellular concentration (approximately 10–15 mM), this compositional shift could theoretically increase TSC by 50%–100% relative to the normal liver.,, Second, chronic inflammation and oxidative stress impair Na+/K+-ATPase pump function, leading to intracellular sodium accumulation., Third, portal hypertension and interstitial fluid retention in decompensated cirrhosis further elevate total tissue sodium content via activation of the renin–angiotensin–aldosterone system. Finally, hepatocyte necrosis and apoptosis cause collapse of ionic gradients, with sodium concentrations in necrotic cells approaching extracellular levels (approximately 140 mM)., Collectively, these mechanisms suggest that ²³Na-MRI-derived TSC may serve as a sensitive biomarker reflecting the severity of hepatic injury across the full spectrum of chronic liver disease.
Despite the promising theoretical rationale and preliminary technical feasibility data, clinical translation remains at a very early stage, and all published abdominal ²³Na-MRI studies to date have focused exclusively on healthy volunteers; no patient data correlating hepatic TSC with the histological fibrosis stage, inflammatory grade, or clinical outcomes exist.
Therefore, further prospective studies with histological validation are warranted to establish the diagnostic utility of hepatic ²³Na-MRI. It should be noted that the evidence base for ²³Na-MRI in chronic liver disease remains substantially more limited than that for ³¹P-MRS, for which multiple clinical studies across diverse hepatic disorders have been conducted. The former currently rests on pathophysiological rationale and preclinical data alone.
Clinical utility of sodium-23 magnetic resonance imaging in hepatocellular carcinoma
HCC represents a compelling target for ²³Na-MRI, as the intracellular sodium concentration in HCC cells is 8–10 times higher than that in normal hepatocytes. This marked ionic imbalance partially arises from the Warburg effect, whereby aerobic glycolysis drives lactate overproduction and subsequent Na+ accumulation via Na+/H+ exchanger activity. From a broader oncological perspective, Leslie et al. demonstrated that elevated tissue Na+ concentration is a consistent hallmark of solid malignancies detectable at the cellular, tissue, and organism (patient) levels, with ²³Na-MRI encoding biologically relevant information beyond conventional morphological imaging. Early preclinical work demonstrated that ²³Na-MRI could serially track HCC tumor growth in animal models and that the implantation site and growth kinetics influenced sodium signal characteristics.
Importantly, the elevated intracellular sodium state of HCC cells may itself constitute a therapeutic vulnerability. Clemente et al. demonstrated that pharmacological augmentation of intracellular Na+ using the ionophore monensin selectively induced cell death in HCC cells while sparing normal hepatocytes, with tumor shrinkage confirmed in murine allograft models. Ashkar et al. further positioned sodium homeostasis disruption as a novel therapeutic target in the clinically urgent context of MASH-related HCC. Nevertheless, all existing evidence for ²³Na-MRI in HCC remains preclinical; no clinical data acquired with commercially available surface coils in patients with HCC have been reported to date. Translation to human imaging will require overcoming the considerable technical challenges inherent to abdominal ²³Na-MRI, and the diagnostic and therapeutic utility of this approach in HCC has yet to be established in clinical studies.
This review summarizes current evidence on the clinical applications of ³¹P-MRS and ²³Na-MRI in upper abdominal imaging. Accumulated research demonstrates that both techniques provide metabolic and physiological information beyond what conventional proton MRI can offer, particularly in the assessment of diffuse liver disease and hepatic tumors. However, it must be acknowledged that the majority of these findings were derived from custom-built coils requiring specialized research infrastructure or UHF systems, limiting their broader clinical applicability.
A critical next step will be to determine the extent to which diagnostically meaningful signals can be obtained using these newly approved coils and to systematically accumulate methodological insights and preliminary clinical findings. Concurrently, standardization of acquisition protocols, quantification methodologies, and interpretation criteria represents an essential unmet need. No consensus currently exists regarding voxel localization strategies, flip angle calibration, or disease-specific diagnostic thresholds, and inter-site reproducibility data are largely absent. Addressing these gaps through multicenter collaborative studies will be a prerequisite for broader clinical adoption.
Footnotes
Acknowledgments
We would like to thank Mr. Naoki Ohishi and Mr. Yoji Yamada, radiological technologists, for their technical assistance with the MRI examinations. We would also like to thank Mr. Jihun Kwon and Mr. Yasutomo Katsumata, employees of Philips Japan, for their assistance with parameter optimization.
Conflict of interest disclosure
The authors declared no conflicts of interest.
References
Wang G, Yang H, Li J, Wen J, Zhong K, Tian C. Overview and progress of X-nuclei magnetic resonance imaging in biomedical studies. Magn Reson Lett. 2023;3(4):327-343.
Wei Y, Yang C, Jiang H, et al. Multi-nuclear magnetic resonance spectroscopy: state of the art and future directions. Insights Imaging. 2022;13(1):135.
Shams Z, Dai J, Gosselink MWJ, et al. Interleaved whole brain 23 Na-MRI and 31 P-MRSI acquisitions at 7 Tesla. NMR Biomed. 2025;38(3):e70012.
Gast LV, Platt T, Nagel AM, Gerhalter T. Recent technical developments and clinical research applications of sodium ( 23 Na) MRI. Prog Nucl Magn Reson Spectrosc. 2023;138-139:1-51.
Chen Q, Shah NJ, Worthoff WA. Compressed sensing in sodium magnetic resonance imaging: techniques, applications, and future prospects. J Magn Reson Imaging. 2022;55(5):1340-1356.
Liu Y, Gu Y, Yu X. Assessing tissue metabolism by phosphorous-31 magnetic resonance spectroscopy and imaging: a methodology review. Quant Imaging Med Surg. 2017;7(6):707-726.
Tsampasian V, Cameron D, Sobhan R, Bazoukis G, Vassiliou VS. Phosphorus magnetic resonance spectroscopy ( 31 P MRS) and cardiovascular disease: the importance of energy. Medicina (Kaunas). 2023;59(1):174.
Yuksel C, Tegin C, O’Connor L, et al. Phosphorus magnetic resonance spectroscopy studies in schizophrenia. J Psychiatr Res. 2015;68:157-166.
Haszto CS, Stanley JA, Iyengar S, Prasad KM. Regionally distinct alterations in membrane phospholipid metabolism in schizophrenia: a meta-analysis of phosphorus magnetic resonance spectroscopy studies. Biol Psychiatry Cogn Neurosci Neuroimaging. 2020;5(3):264-280.
Abdurrachim D, Prompers JJ. Evaluation of cardiac energetics by non-invasive 31 P magnetic resonance spectroscopy. Biochim Biophys Acta Mol Basis Dis. 2018;1864(5 Pt B):1939-1948.
Jett S, Boneu C, Zarate C, et al. Systematic review of 31 P-magnetic resonance spectroscopy studies of brain high energy phosphates and membrane phospholipids in aging and Alzheimer’s disease. Front Aging Neurosci. 2023;15:1183228.
Jing Y, Haeger A, Boumezbeur F, Binkofski F, Reetz K, Romanzetti S. Neuroenergetic alterations in neurodegenerative diseases: a systematic review and meta-analysis of in vivo 31 P-MRS studies. Ageing Res Rev. 2024;101:102488.
Valkovič L, Chmelík M, Krššák M. In-vivo 31 P-MRS of skeletal muscle and liver: a way for non-invasive assessment of their metabolism. Anal Biochem. 2017;529:193-215.
Seelen LWF, van den Wildenberg L, van der Kemp WJM, et al. Prospective of 31 P MR spectroscopy in hepatopancreatobiliary cancer: a systematic review of the literature. J Magn Reson Imaging. 2023;57(4):1144-1155.
Rivera D. Emerging role for 7T MRI and metabolic imaging for pancreatic and liver cancer. Metabolites. 2022;12(5):409.
Menon RG, Chang G, Regatte RR. Musculoskeletal MR imaging applications at ultra-high (7T) field strength. Magn Reson Imaging Clin N Am. 2021;29(1):117-127.
Singh M, Jhajharia A, Pruthi R, Carmichael OT. 31 P-MRS-measured phosphocreatine recovery kinetics in human muscles in health and disease-a systematic review and meta-analysis. NMR Biomed. 2025;38(5):e70023.
Rusakova IL, Rusakov YY. Modern quantum chemistry methodology for predicting 31 P nuclear magnetic resonance chemical shifts. Int J Mol Sci. 2026;27(2):704.
Poku LO, Phil M, Cheng Y, Wang K, Sun X. 23 Na-MRI as a noninvasive biomarker for cancer diagnosis and prognosis. J Magn Reson Imaging. 2021;53(4):995-1014.
Wiggins GC, Brown R, Lakshmanan K. High-performance radiofrequency coils for (23)Na MRI: brain and musculoskeletal applications. NMR Biomed. 2016;29(2):96-106.
Zöllner FG, Konstandin S, Lommen J, et al. Quantitative sodium MRI of kidney. NMR Biomed. 2016;29(2):197-205.
Zaric O, Juras V, Szomolanyi P, et al. Frontiers of sodium MRI revisited: from cartilage to brain imaging. J Magn Reson Imaging. 2021 Jul;54(1):58-75.
Ridley B, Morsillo F, Zaaraoui W, Nonino F. Variability by region and method in human brain sodium concentrations estimated by 23 Na magnetic resonance imaging: a meta-analysis. Sci Rep. 2023;13(1):3222.
Akbari A, McIntyre CW. Recent advances in sodium magnetic resonance imaging and its future role in kidney disease. J Clin Med. 2023;12(13):4381.
Martin K, Tan SJ, Toussaint ND. Magnetic resonance imaging determination of tissue sodium in patients with chronic kidney disease. Nephrology (Carlton). 2022;27(2):117-125.
Seo Y, Murakami M, Watari H, et al. Intracellular pH determination by a 31P-NMR technique. The second dissociation constant of phosphoric acid in a biological system. J Biochem. 1983;94(3):729-734.
Francis IR, Chenevert TL, Gubin B, et al. Malignant hepatic tumors: P-31 MR spectroscopy with one-dimensional chemical shift imaging. Radiology. 1991;180(2):341-344.
Schmid AI, Chmelík M, Szendroedi J, et al. Quantitative ATP synthesis in human liver measured by localized 31P spectroscopy using the magnetization transfer experiment. NMR Biomed. 2008;21(5):437-443.
ter Voert EG, Heijmen L, van Laarhoven HW, Heerschap A. In vivo magnetic resonance spectroscopy of liver tumors and metastases. World J Gastroenterol. 2011;17(47):5133-5149.
van den Wildenberg L, Runderkamp BA, Seelen LWF, et al. Measurement of metabolite levels and treatment-induced changes in hepatic metastases of gastro-esophageal cancer using 7-T phosphorus magnetic resonance spectroscopic imaging. NMR Biomed. 2024;37(9):e5155.
Ordidge RJ, Connelly A, Lohman JAB. Image-selected in vivo spectroscopy (ISIS). A new technique for spatially selective nmr spectroscopy. J Magn Reson. 1986;66(2):283-294.
Brinkmann G, Melchert UH, Muhle C, et al. Influence of different fasting periods on P-31-MR-spectroscopy of the liver in normals and patients with liver metastases. Eur Radiol. 1996;6(1):62-65.
Li H, Yao L, Xiao Z, Li S. Detecting the stage of fibrosis in non-alcoholic fatty liver disease by 9.4T phosphorus magnetic resonance spectroscopy. Magn Reson Med Sci. 2025;24(4):2024-0080.
Sevastianova K, Hakkarainen A, Kotronen A, et al. Nonalcoholic fatty liver disease: detection of elevated nicotinamide adenine dinucleotide phosphate with in vivo 3.0-T 31P MR spectroscopy with proton decoupling. Radiology. 2010;256(2):466-473.
Valkovič L, Gajdošík M, Traussnigg S, et al. Application of localized ³¹P MRS saturation transfer at 7 T for measurement of ATP metabolism in the liver: reproducibility and initial clinical application in patients with non-alcoholic fatty liver disease. Eur Radiol. 2014;24(7):1602-1609.
Meyerhoff DJ, Boska MD, Thomas AM, Weiner MW. Alcoholic liver disease: quantitative image-guided P-31 MR spectroscopy. Radiology. 1989;173(2):393-400. Erratum in: Radiology. 1990;176(2):584.
Menon DK, Harris M, Sargentoni J, Taylor-Robinson SD, Cox IJ, Morgan MY. In vivo hepatic 31P magnetic resonance spectroscopy in chronic alcohol abusers. Gastroenterology. 1995;108(3):776-788.
Lim AK, Patel N, Hamilton G, et al. 31P MR spectroscopy in assessment of response to antiviral therapy for hepatitis C virus-related liver disease. AJR Am J Roentgenol. 2007;189(4):819-823.
Menon DK, Sargentoni J, Taylor-Robinson SD, Bet al. Effect of functional grade and etiology on in vivo hepatic phosphorus-31 magnetic resonance spectroscopy in cirrhosis: biochemical basis of spectral appearances. Hepatology. 1995;21(2):417-427.
Dezortova M, Taimr P, Skoch A, Spicak J, Hajek M. Etiology and functional status of liver cirrhosis by 31P MR spectroscopy. World J Gastroenterol. 2005;11(44):6926-6931.
Taylor-Robinson SD, Sargentoni J, Bell JD, et al. In vivo and in vitro hepatic 31P magnetic resonance spectroscopy and electron microscopy of the cirrhotic liver. Liver. 1997;17(4):198-209.
Schmid AI, Szendroedi J, Chmelik M, Krssák M, Moser E, Roden M. Liver ATP synthesis is lower and relates to insulin sensitivity in patients with type 2 diabetes. Diabetes Care. 2011;34(2):448-453.
Chmelik M, Považan M, Krššák M, et al. In vivo (31)P magnetic resonance spectroscopy of the human liver at 7 T: an initial experience. NMR Biomed. 2014;27(4):478-485.
McKenzie EJ, Jackson M, Sun J, Volotovskyy V, Gruwel ML. Monitoring the development of hepatocellular carcinoma in woodchucks using 31P-MRS. MAGMA. 2005;18(4):201-205.
Laufs A, Livingstone R, Nowotny B, et al. Quantitative liver 31P magnetic resonance spectroscopy at 3T on a clinical scanner. Magn Reson Med. 2014;71(5):1670-1675.
Rata M, Giles SL, deSouza NM, Leach MO, Payne GS. Comparison of three reference methods for the measurement of intracellular pH using 31P MRS in healthy volunteers and patients with lymphoma. NMR Biomed. 2014;27(2):158-162.
Meyerhoff DJ, Karczmar GS, Weiner MW. Abnormalities of the liver evaluated by 31P MRS. Invest Radiol. 1989;24(12):980-984.
Schilling A, Gewiese B, Berger G, et al. Liver tumors: follow-up with P-31 MR spectroscopy after local chemotherapy and chemoembolization. Radiology. 1992;182(3):887-890.
Seelen LWF, van den Wildenberg L, Gursan A, et al. 31 P MR spectroscopy in the pancreas: repeatability, comparison with liver, and pilot pancreatic cancer data. J Magn Reson Imaging. 2024;60(6):2657-2666.
Madelin G, Lee JS, Regatte RR, Jerschow A. Sodium MRI: methods and applications. Prog Nucl Magn Reson Spectrosc. 2014;79:14-47.
Murphy E, Eisner DA. Regulation of intracellular and mitochondrial sodium in health and disease. Circ Res. 2009;104(3):292-303.
Riemer F, McHugh D, Zaccagna F, et al. Measuring tissue sodium concentration: cross-vendor repeatability and reproducibility of 23 Na-MRI across two sites. J Magn Reson Imaging. 2019;50(4):1278-1284.
Rose AM, Valdes R. Understanding the sodium-pump and its relevance to disease. Clin Chem. 1994;40:1674–1685.
Skou JC, Esmann M. The Na,K-ATPase. J Bioenerg Biomembr. 1992;24(3):249-261.
Madelin G, Regatte RR. Biomedical applications of sodium MRI in vivo. J Magn Reson Imaging. 2013;38(3):511-29.
James JR, Panda A, Lin C, Dydak U, Dale BM, Bansal N. In vivo sodium MR imaging of the abdomen at 3T. Abdom Imaging. 2015;40(7):2272-2280.
Konstandin S, Nagel AM. Measurement techniques for magnetic resonance imaging of fast relaxing nuclei. MAGMA. 2014;27(1):5-19.
Fleysher L, Oesingmann N, Brown R, Sodickson DK, Wiggins GC, Inglese M. Noninvasive quantification of intracellular sodium in human brain using ultrahigh-field MRI. NMR Biomed. 2013;26(1):9-19.
Birchall JR, Horvat-Menih I, Kaggie JD, et al. Quantitative 23 Na magnetic resonance imaging in the abdomen at 3 T. MAGMA. 2024;37(4):737-748.
Towner RA, Janzen EG, Chu SC, Rath A. Use of 1H/23Na and 1H/31P double frequency tuned birdcage coils to study in vivo carbon tetrachloride-induced hepatotoxicity in rats. Magn Reson Imaging. 1992;10(4):679-688.
Friedman SL. Mechanisms of hepatic fibrogenesis. Gastroenterology. 2008;134(6):1655-1669.
Bataller R, Brenner DA. Liver fibrosis. J Clin Invest. 2005;115(2):209-218. Erratum in: J Clin Invest. 2005 Apr;115(4):1100.
Tsochatzis EA, Bosch J, Burroughs AK. Liver cirrhosis. Lancet. 2014;383(9930):1749-1761.
Suhail M. Na, K-ATPase: ubiquitous multifunctional transmembrane protein and its relevance to various pathophysiological conditions. J Clin Med Res. 2010;2(1):1-17.
Rose C, Kresse W, Kettenmann H. Acute insult of ammonia leads to calcium-dependent glutamate release from cultured astrocytes, an effect of pH. J Biol Chem. 2005;280(22):20937-20944.
Schrier RW, Arroyo V, Bernardi M, Epstein M, Henriksen JH, Rodés J. Peripheral arterial vasodilation hypothesis: a proposal for the initiation of renal sodium and water retention in cirrhosis. Hepatology. 1988;8(5):1151-1157.
Guicciardi ME, Malhi H, Mott JL, Gores GJ. Apoptosis and necrosis in the liver. Compr Physiol. 2013;3(2):977-1010.
Clemente N, Baroni S, Fiorilla S, et al. Boosting intracellular sodium selectively kills hepatocarcinoma cells and induces hepatocellular carcinoma tumor shrinkage in mice. Commun Biol. 2023;6:574.
Birkeland ES, Koch LM, Dechant R. Another consequence of the Warburg effect? Metabolic regulation of Na + /H + exchangers may link aerobic glycolysis to cell growth. Front Oncol. 2020;10:1561.
Leslie TK, James AD, Zaccagna F, et al. Sodium homeostasis in the tumour microenvironment. Biochim Biophys Acta Rev Cancer. 2019;1872(2):188304.
Babsky AM, Ju S, Bennett S, George B, McLennan G, Bansal N. Effect of implantation site and growth of hepatocellular carcinoma on apparent diffusion coefficient of water and sodium MRI. NMR Biomed. 2012;25(2):312-321.
Ashkar A, Fiorilla S, Tasso F, Carini R. NASH-related Hepatocellular carcinoma: current therapeutic approaches and the emerging role of sodium homeostasis as a novel targeting strategy. Front Pharmacol. 2025;16:1671001.